Learning to spot patterns on a candlestick chart is one of the most effective ways for beginners to explore investing. If you are wondering how to invest in stocks and cryptocurrencies, recognising a bullish flag is an excellent place to start.
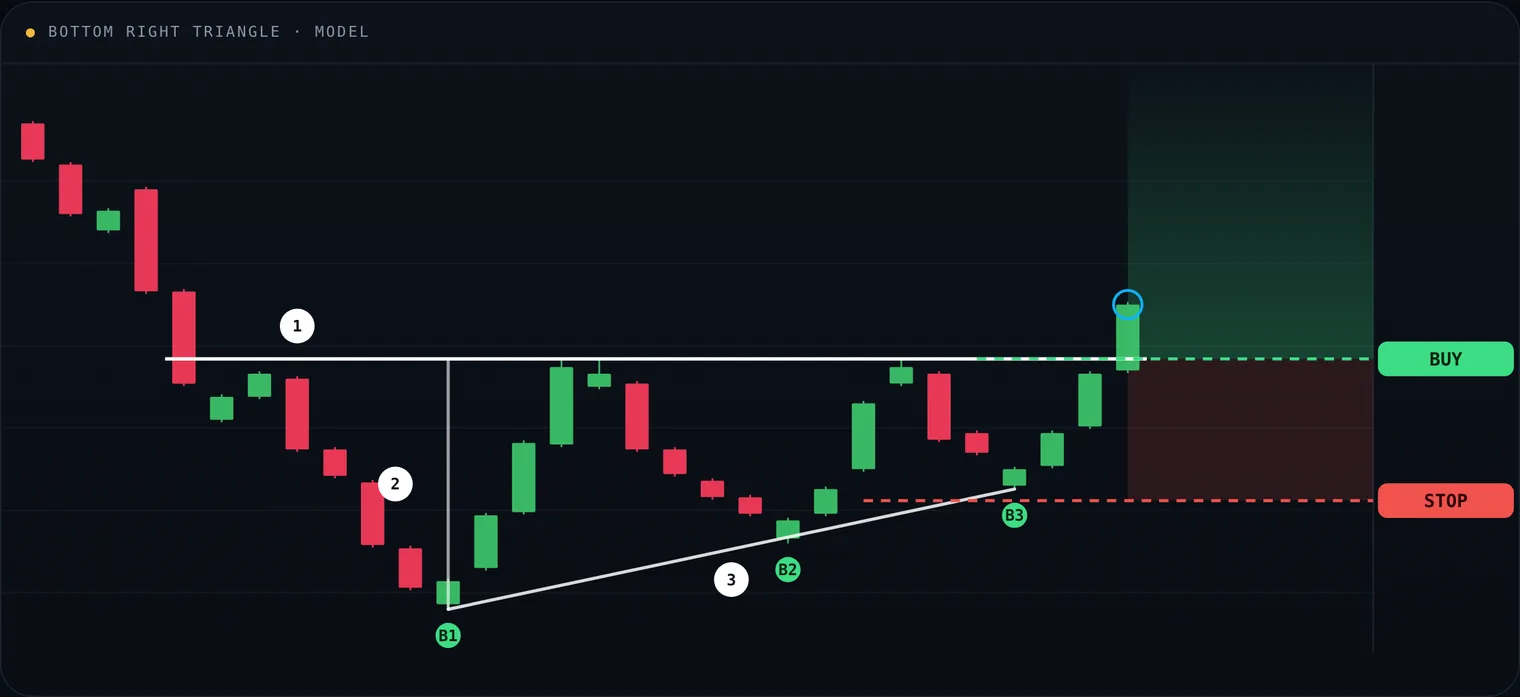
The Bottom Right Triangle: 1 the horizontal, 2 the vertical, 3 the hypotenuse joining the rising lows (B1–B3). Buy on the close above the horizontal; stop below the last bounce low.
What is a chart pattern?
A chart pattern is a formation on a candlestick chart that helps traders anticipate future moves from past behaviour. Patterns signal buy points, sell points or potential reversals.
Bullish flag patterns
Bullish flags point to upward momentum. Yard Charts detects four of them:
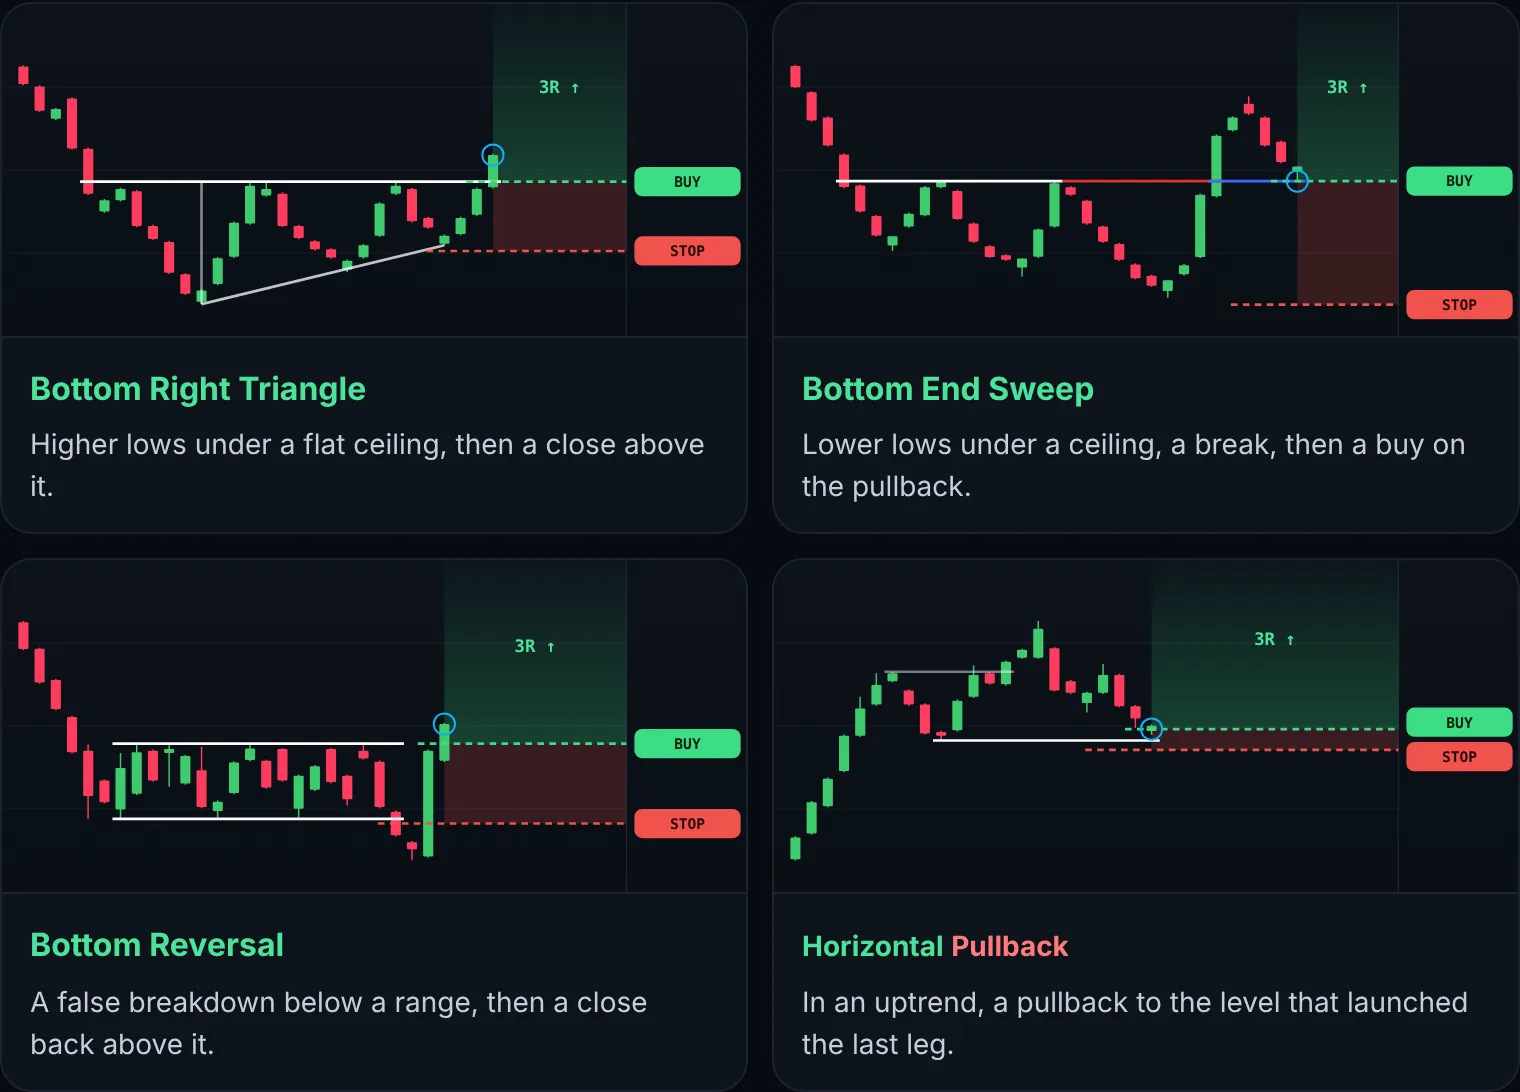
- Bottom Right Triangle: Higher lows under a flat ceiling, then a close above it.
- Bottom End Sweep: Lower lows under a ceiling, a break, then a buy on the pullback.
- Bottom Reversal: A false breakdown below a range, then a close back above it.
- Horizontal Pullback: In an uptrend, a pullback to the level that launched the last leg.
Worked example: the Bottom Right Triangle
The Bottom Right Triangle is one of the most reliable bullish reversal patterns. It looks like a right triangle:
- Line 1, the horizontal: connects two or more near-equal highs.
- Line 2, the vertical: drops from the horizontal to the lowest point beneath it.
- Line 3, the hypotenuse: connects the rising lows, forming a triangle pointing up.
Formation criteria
- At least two (ideally three) ascending bounces below the horizontal line.
- The fall to each low should be slower than the bounce back up, which makes the breakout more reliable.
Trade hint
- Buy when price closes above the horizontal line after at least two bounces.
- Stop loss just below the last bounce low, to limit the loss if the pattern fails.
See it on a real chart in PLCE’s Perfect Signal, or read the full pattern page.
Bearish flag patterns
Bullish flags prepare you to ride a wave up; bearish flags help you spot moves down. The idea is to sell at a higher price and buy back lower, which is usually harder. Yard Charts detects four:
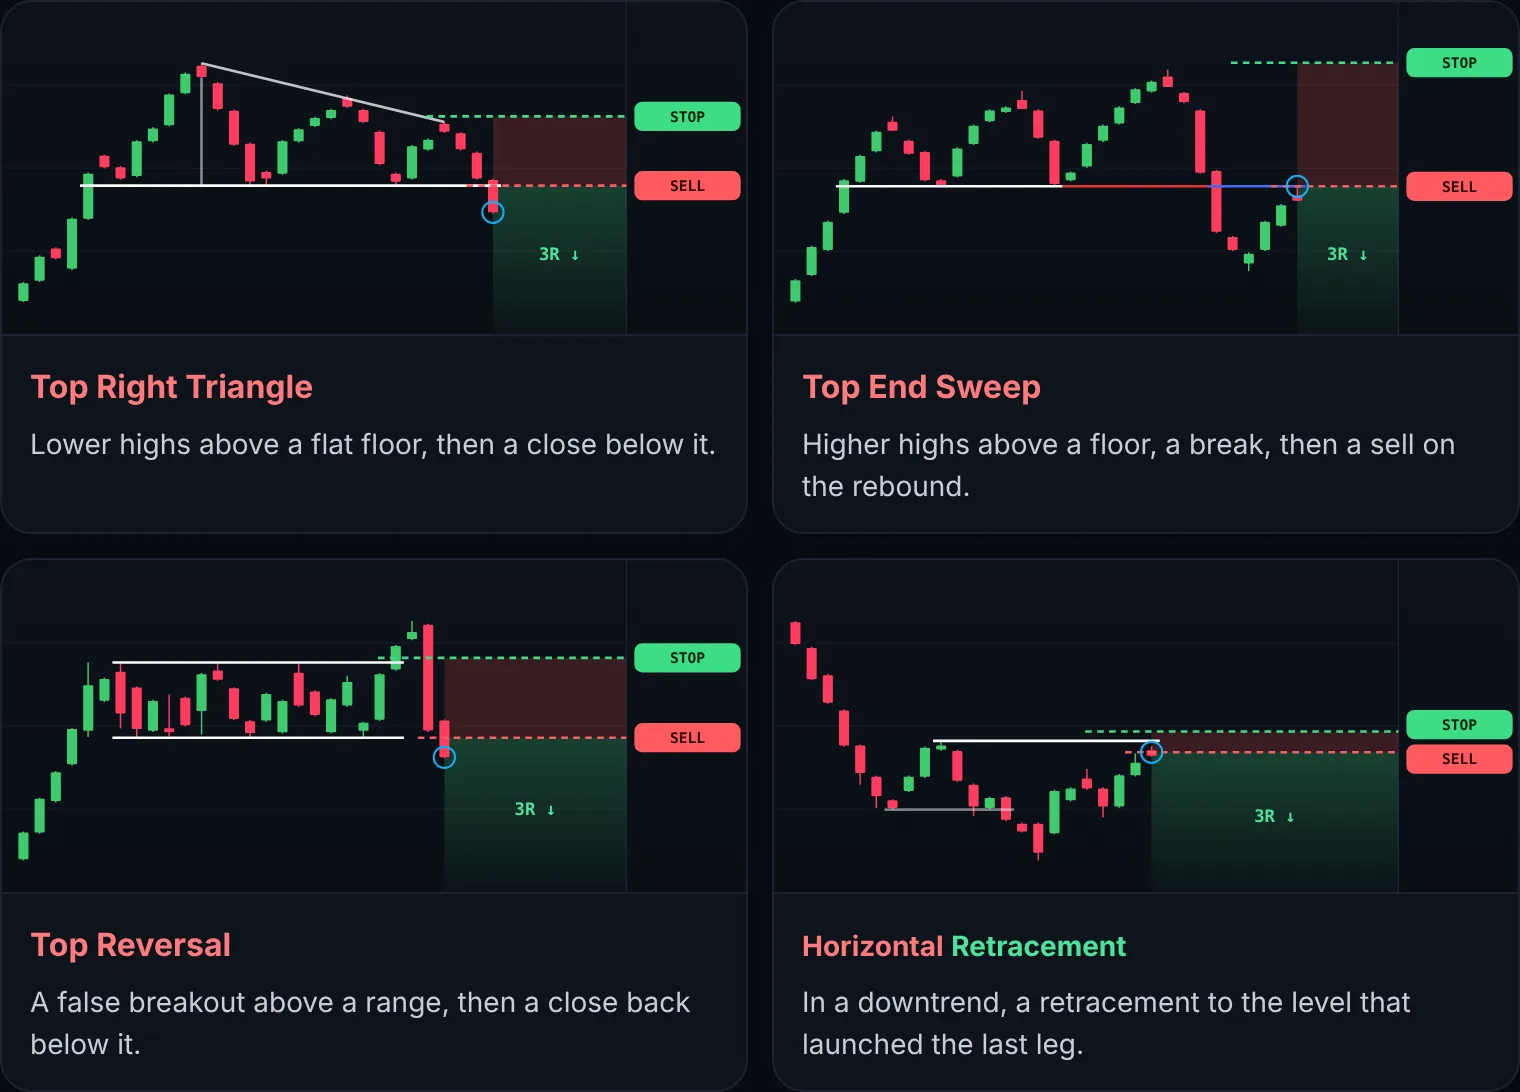
- Top Right Triangle: Lower highs above a flat floor, then a close below it.
- Top End Sweep: Higher highs above a floor, a break, then a sell on the rebound.
- Top Reversal: A false breakout above a range, then a close back below it.
- Horizontal Retracement: In a downtrend, a retracement to the level that launched the last leg.
More detail in 4 Powerful Bearish Flags Patterns.
How to start investing with patterns
It begins with learning candle patterns and practising chart analysis. If manual analysis feels overwhelming, Yard Charts scans more than 13,000 stocks and cryptocurrencies for you, with buy and sell levels and stop-loss hints to manage your risk: ideal for beginners and pros alike.
Try it free. Create your free account and get your first alerts today.
Alerts and examples are for education only and are not investment advice. Past patterns do not guarantee future results.
Disclaimer: Yard Charts provides technical-analysis tools and alerts. It is not investment advice. Trading involves risk of loss.