In volatile markets, spotting reliable bearish patterns gives you an edge. Knowing when momentum is fading, or when price hints at a reversal, helps you avoid costly mistakes and enter with more precision. Here are the four bearish patterns Yard Charts detects.
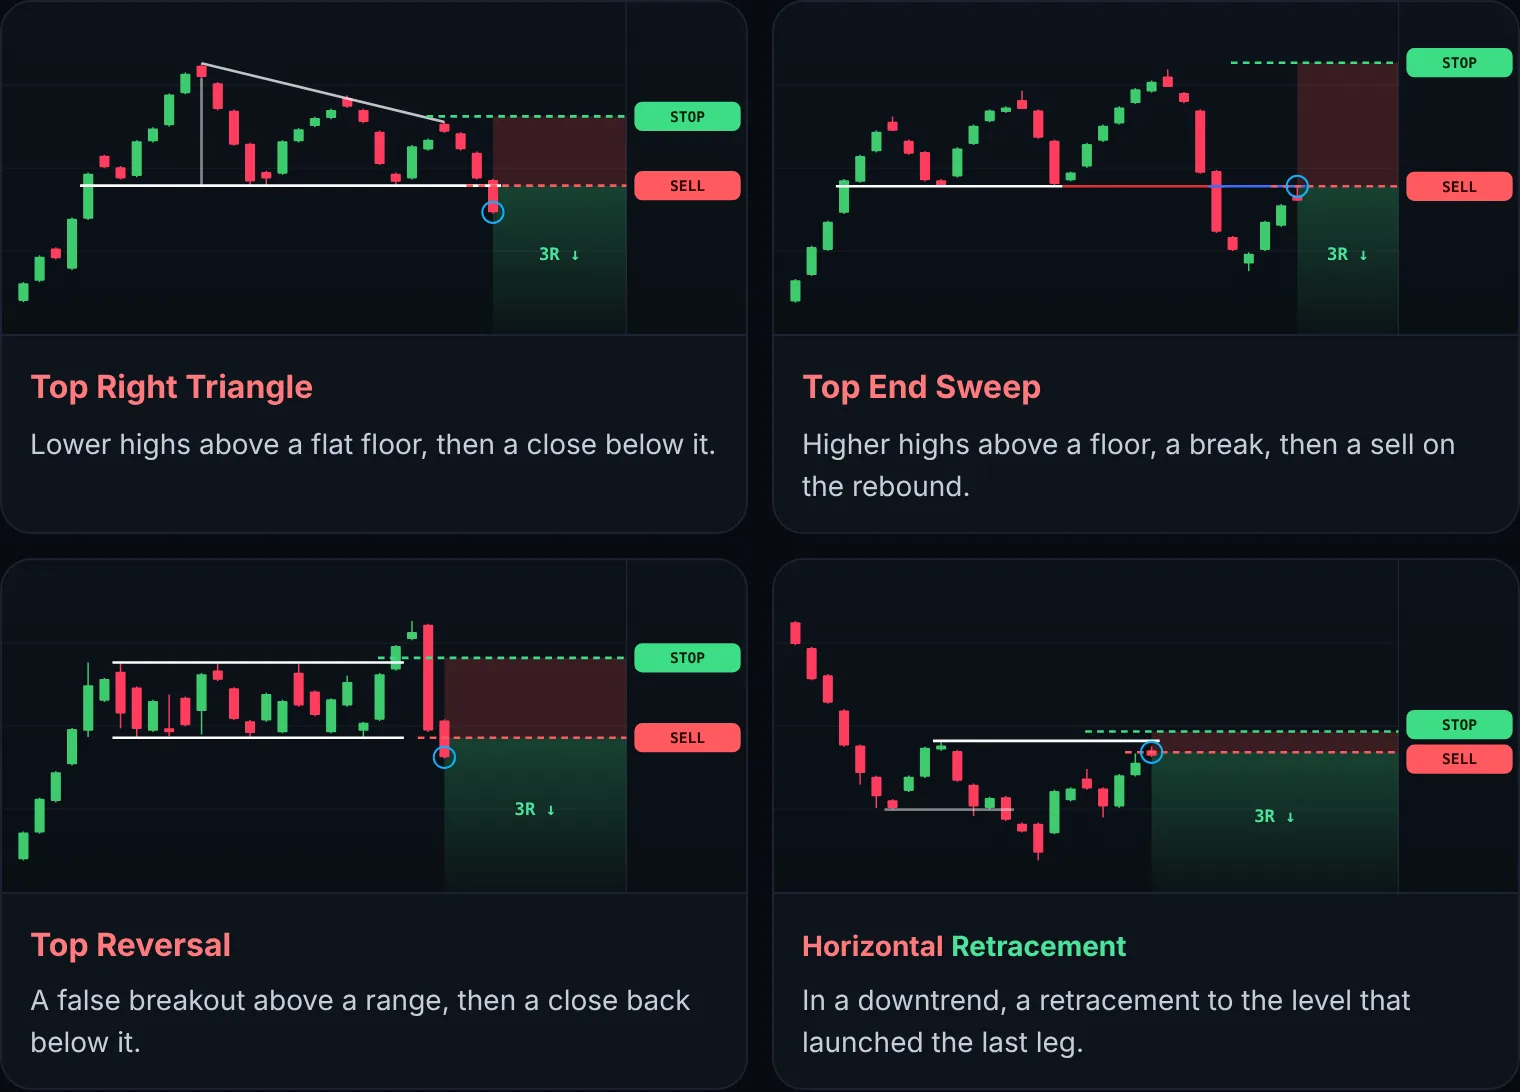
- Top Right Triangle: Lower highs above a flat floor, then a close below it.
- Top End Sweep: Higher highs above a floor, a break, then a sell on the rebound.
- Top Reversal: A false breakout above a range, then a close back below it.
- Horizontal Retracement: In a downtrend, a retracement to the level that launched the last leg.
Top Reversal
What it looks like: an uptrend stalls into a trading range. Price breaks above the range, as if the rise were resuming, then drops sharply and closes below the range’s lower line.
Why it matters: the false breakout traps late buyers. When price cannot hold above the range, bullish momentum has stalled.
Trading insight: the sell triggers on the close below the lower line; the buy stop goes above the range or the recent high. Read the pattern.
Top End Sweep
What it looks like: price makes higher highs above a flat floor, sweeping out the last buyers, then breaks down through the floor.
Why it matters: the higher highs lure in late buyers before the reversal catches emotional traders off guard.
Trading insight: wait for the break and the rebound to the projected line; the sell sits at its tip, with the buy stop above the last high. Read the pattern.
Top Right Triangle
What it looks like: a consolidation near the top of a move that forms a right-angled triangle: the support stays flat while the highs get lower.
Why it matters: each rally is weaker than the last, a sign of fading buying pressure. A close below the horizontal support is the trigger.
Trading insight: ideal for anticipating breakdowns with clear risk levels: buy stop just above the last bounce high. Read the pattern.
Horizontal Retracement
What it looks like: in a downtrend, price retraces up to the horizontal level that launched the last leg down, and fails there.
Why it matters: repeated rejection at the same price reveals strong supply, and the downtrend tends to resume.
Trading insight: Yard Charts alerts you at a 90% and a 95% retracement so you can prepare the sell near resistance, with the buy stop above it. Read the pattern.
Trade them with Yard Charts
All four patterns are recognised automatically. Every alert comes with:
- Daily pattern alerts (60-minute alerts on Premium)
- Entry and exit zones
- Stop-loss levels
Ready to spot the next bearish setup? Start for free and apply technical patterns with confidence and control.
Alerts and examples are for education only and are not investment advice. Past patterns do not guarantee future results.
Disclaimer: Yard Charts provides technical-analysis tools and alerts. It is not investment advice. Trading involves risk of loss.