Cipher Mining (CIFR) Rally: How a Yard Charts Alert Caught the Breakout
Markets often shift quietly before momentum becomes obvious. On September 2, 2025, Yard Charts identified a Bottom Right Triangle on Cipher Mining (CIFR), just as the stock pressed against long-term resistance. Within ten days CIFR was back in double digits.
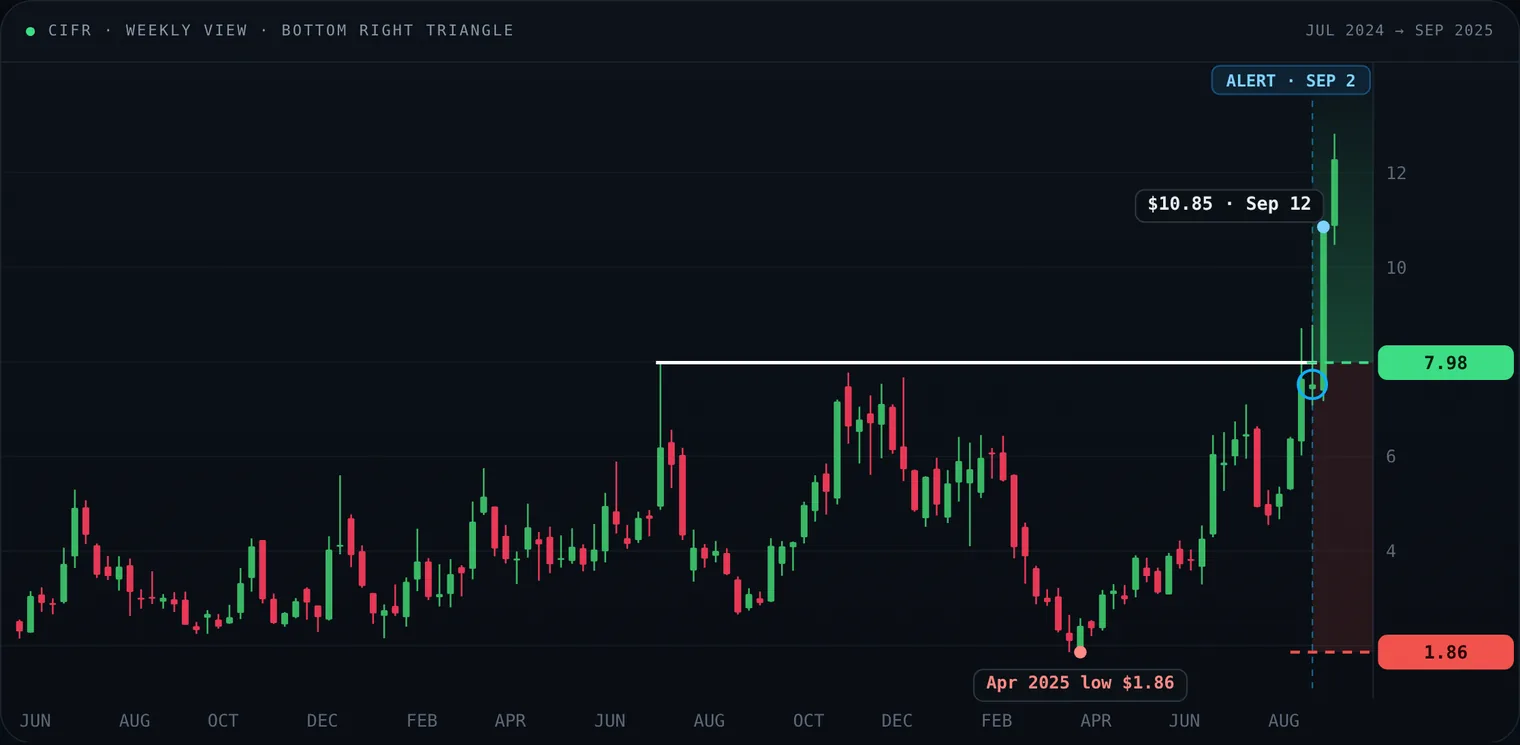
Cipher Mining (CIFR), weekly. The river line is the July 2024 high at $7.98; the stop sits at the April 2025 low of $1.86. CIFR closed at $10.85 on September 12.
- Alert: Sep 2 (2025 · daily scan)
- Buy: $7.98 (July 2024 high)
- Sell stop: $1.86 (April 2025 low)
- Sep 12 close: $10.85 (+36% in ten days)
From alert to rally
On September 2, Yard Charts issued a Bottom Right Triangle alert on CIFR with the buy at $7.98 and a protective stop far below at $1.86. The buy is the July 2024 high that had capped the stock for more than a year; the stop is the April 2025 low where the triangle began.
The alert marked a sharp change in sentiment. Within ten days CIFR was above $10, closing at $10.85 on September 12, more than 36% above the buy.
Why such a wide stop? This triangle spans more than a year, so the pattern only fails below its starting low. A stop that far away calls for a smaller position, or a tighter stop of your own (your nominal risk) under a more recent swing. Read about absolute and nominal risk.
The pattern
A Bottom Right Triangle appears when buyers absorb overhead supply and push price into a narrowing range at the lower right of the chart. As higher lows press against the horizontal, tension builds until expanding volume drives the breakout. On CIFR the alert arrived just as the pattern matured.
How the price moved
The break above $8 was the first clean push through that resistance in more than a year, and volume confirmed it. On September 12 more than 32 million shares changed hands. The chart turned bullish again, and the market began to reassess the company against its early peaks near $14.
Fundamental drivers
In August Cipher reported Bitcoin production above 500 coins and steady growth in deployed hash rate. Second-quarter results showed revenue growth and better profitability from tighter cost control. Meanwhile Bitcoin rebounded, lifting miners, and analysts raised price targets on liquid names like Cipher.
Lessons for traders
Lessons
- Chart structure matters. Bottom Right Triangles often precede decisive breakouts when accumulation is under way.
- Look for alignment. Improving fundamentals plus a bullish chart raise the odds of follow-through.
- Define the risk. The $1.86 stop looked distant, but it anchored the trade in discipline; size the position to it.
- Volume confirms conviction. The spike in activity signalled strong participation.
Final thoughts
The CIFR triangle was more than a shape on a chart: it was a window into accumulating demand and improving fundamentals. When structure and story line up, rallies can go further and faster than expected. See the pattern rules.
Alerts and examples are for education only and are not investment advice. Past patterns do not guarantee future results. Price data: daily OHLC from Yahoo Finance. Alert levels are those published by Yard Charts. Weekly candles.
Disclaimer: Yard Charts provides technical-analysis tools and alerts. It is not investment advice. Trading involves risk of loss.