Every alert is built the same way, but no two alerts look the same. When the shape changes, the buy and the sell stop change with it. That pair is the trade: different shape, different risk-reward.
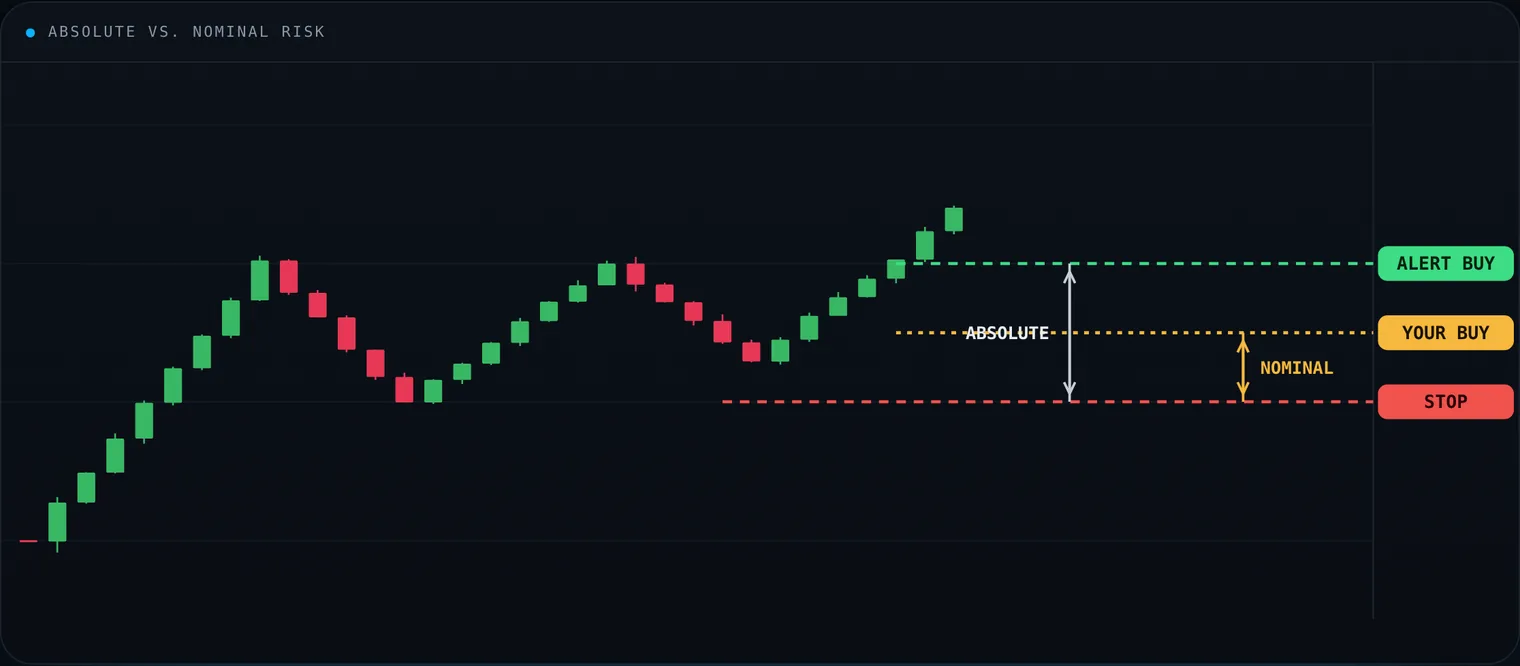
The alert prints its own buy and stop: that distance is the absolute risk. Where you actually buy sets your nominal risk.
Warranted risk
Warranted risk is the risk you are willing to take because it feels cheap enough to live with. Here it is a relative measure:
Warranted risk = (Nominal risk ÷ Absolute risk) ÷ Absolute reward
Lower is better. That is the whole game.
Absolute risk
Absolute risk is already inside the alert. It is the distance between the alert’s buy-at and its sell stop-at. The system prints it; you do not invent it.
Nominal risk
Nominal risk is the distance you actually take: your real buy and your real stop. You choose that number. Keep the two apart on purpose:
Absolute risk
- The risk the alert is built on
- Alert buy-at → alert sell stop
- Printed by the system
Nominal risk
- The risk you put in the market
- Your buy → your stop
- Chosen by you
The catch
Cutting nominal risk below absolute risk looks cleaner: a better risk-reward on paper. There is a cost. The further below the alert buy you park your order, the more likely it never fills.
Sometimes the absolute risk is wide and you have to tighten. Sometimes it is already tight against the shape, and tightening means missing the move. Matching nominal risk to absolute risk is not a formula. It is judgment, built by reading many alerts and tying each one to the story behind the ticker: the business, the tape, the environment it lives in.
Absolute reward
Absolute reward is your call: how far price can reasonably run, up or down, over the window you care about. That is the window on the chart, or the one you project forward from the fundamental mechanics.
- Short time frames: mostly the chart. Fibonacci projections, symmetry and wave structure belong in the quiver.
- Medium and long-term trades: the chart plus the forces that can carry a longer target.
- Long-term positions are the compounding engine, where the original capital rides the asset’s growth path.
Why the chart still leads
Charts often move before the news. — A point Stanley Druckenmiller has made for years
A chart is not decoration. It is every print, including the prints from people who already know more than the headline. That is why a chart can show today what only becomes obvious days, months or a year later, and why it can flash a warning while the fundamental story still sounds fine.
In the wild: ALMS, nominal risk below absolute risk
- Alert: Nov 10, 2025 (Bottom Right Triangle)
- Alert buy: $4.87 (absolute risk $0.49 (≈10%))
- Sell stop: $4.38
- Your buy: $4.61 (nominal risk $0.23 (≈5%))
- Read the risk, then set yours. The alert risk of $0.49, about 10%, was too wide for a name that wild. The buy was set lower, at $4.61, for a nominal risk of about 5%.
- Fill. Price dipped to $4.60 on November 14 and the resting order at $4.61 filled. Position on, stop unchanged at $4.38.
- What happened. The triangle resolved upwards. ALMS closed at $11.12 on December 5 and traded above $24 in mid-January 2026.
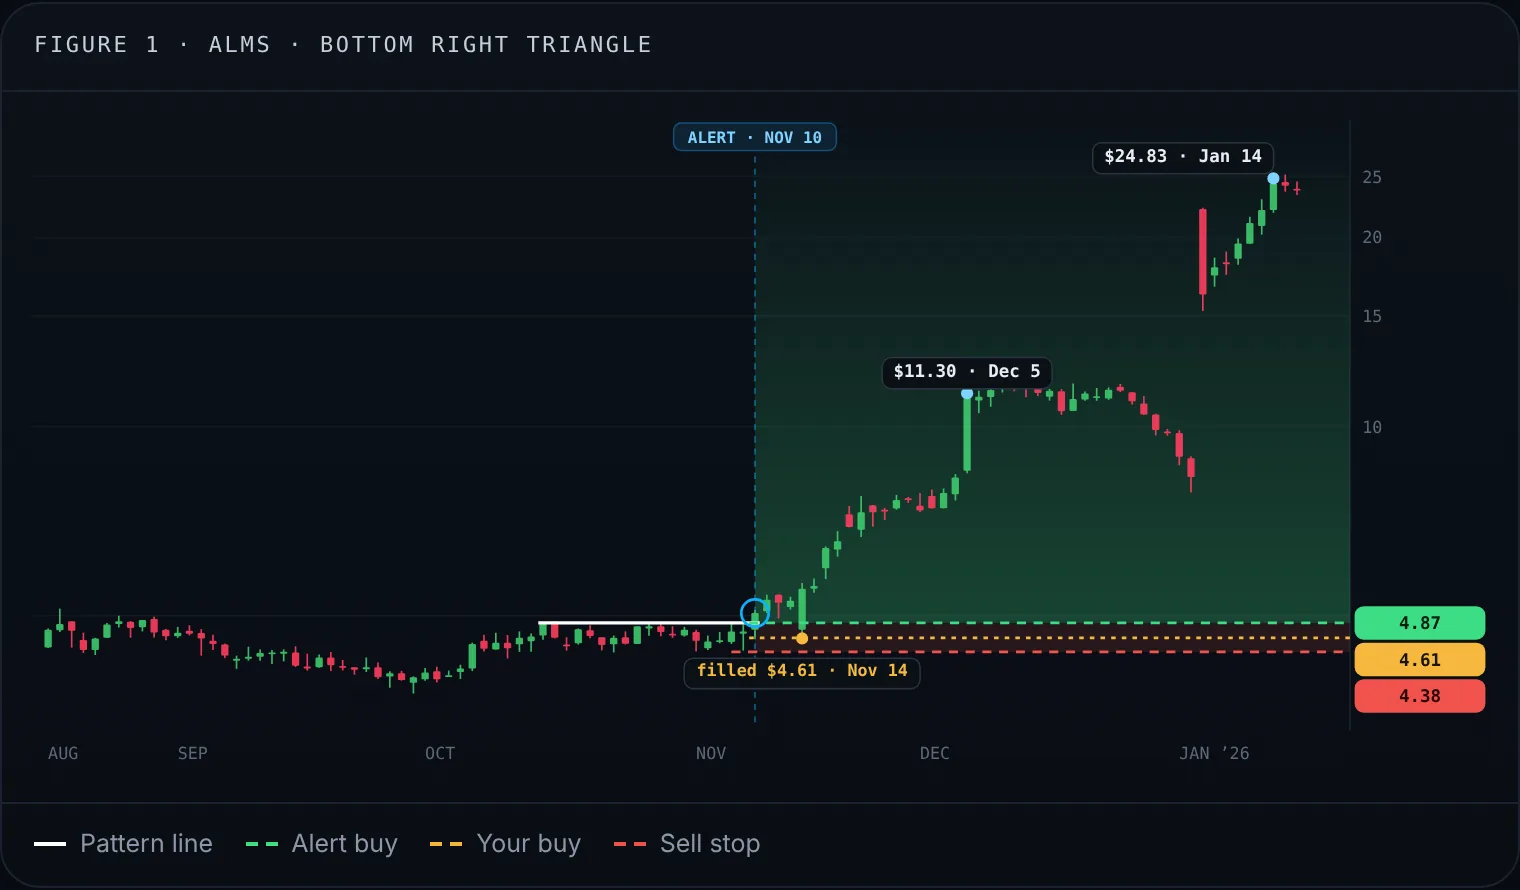
Alumis (ALMS), daily, log scale. White: the triangle’s horizontal. Green: alert buy. Gold: the lower buy actually used. Red: sell stop.
In the wild: APE, nominal risk above absolute risk
- Alert: Apr 23, 2026 (Bottom End Sweep)
- Alert buy: $0.097 (absolute risk $0.015 (≈16%))
- Sell stop: $0.082
- Your buy: $0.1000 (nominal risk $0.018 (≈18%))
- Read the risk, then set yours. An absolute risk of about 16% was fair for a coin this fast, given earlier flushes against the current base. The buy was set slightly above the alert, at $0.1000.
- Fill. Filled the next session, April 24, at $0.1000 on the open. Distance to the stop: $0.018. Exit at $0.0819 if the pattern dies, one tick under the alert stop.
- What happened. ApeCoin ran more than 2.5× within hours, touching $0.258. The exit came the same day, when the vertical move matched the full width of the consolidation and met four-month resistance from the prior downtrend. Speed plus level was enough; re-entry was left open lower, after another look at the ApeCoin DAO and its place in Web3.
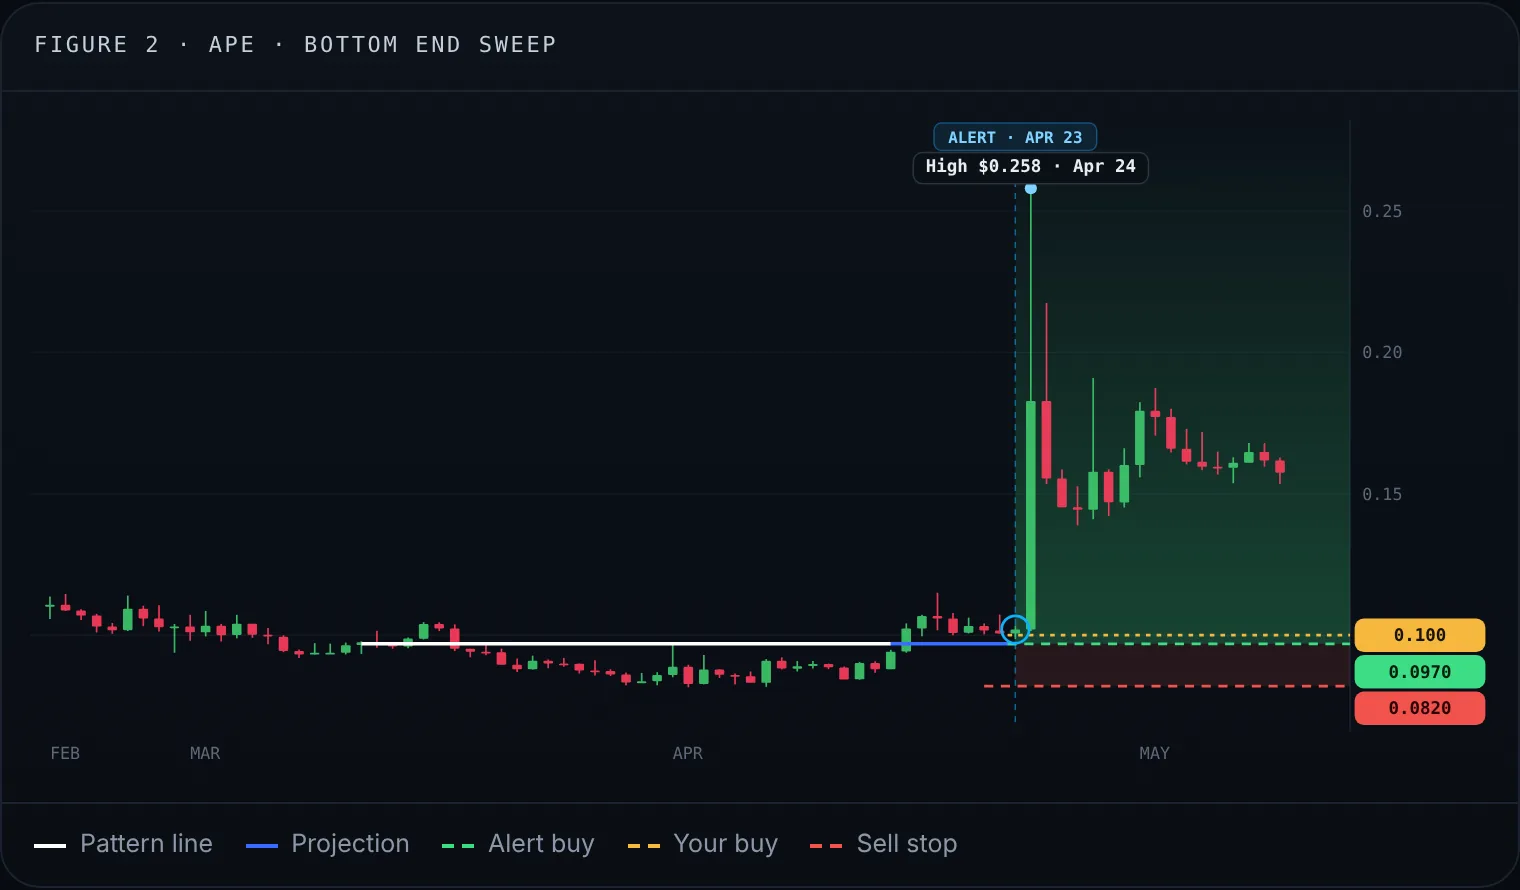
ApeCoin (APE-USD), daily. White: the horizontal; blue: its projection to the alert; gold: the slightly higher buy used.
Key takeaways
- The alert prints the absolute risk: buy-at to sell stop-at.
- You choose the nominal risk: your buy to your stop.
- Tighter is not always better: an order parked too low may never fill.
- Score the trade on warranted risk: nominal over absolute, divided by the reward you expect.
Alerts and examples are for education only and are not investment advice. Past patterns do not guarantee future results. Price data for the examples: daily OHLC from Yahoo Finance.
Disclaimer: Yard Charts provides technical-analysis tools and alerts. It is not investment advice. Trading involves risk of loss.