A breakout is when price closes beyond a clear support or resistance level with enough force to leave the prior range. It is a shift in probability, not a guarantee: some run, some fail in minutes.
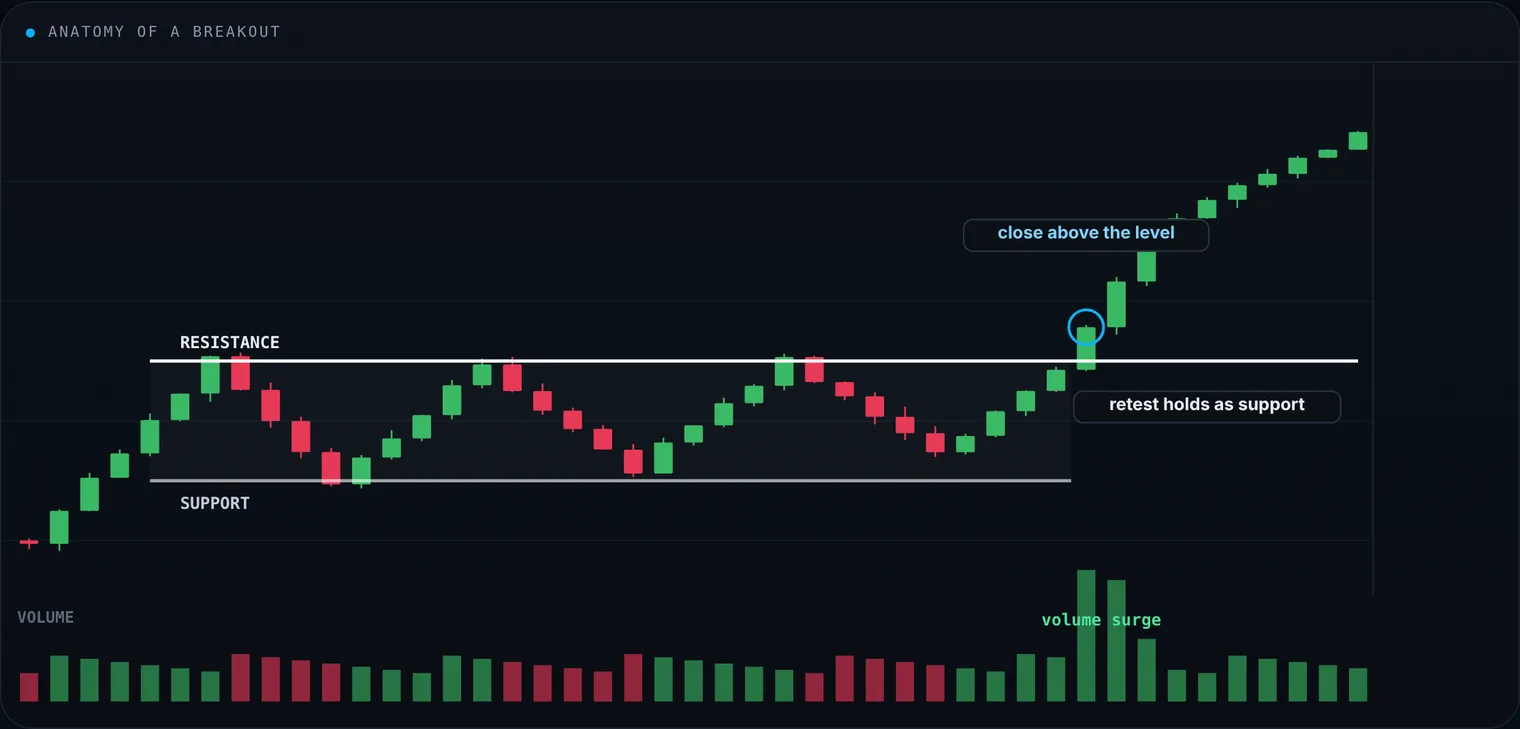
A range breaks: price closes above resistance on a surge in volume, then the old ceiling holds as support on the retest.
Support and resistance hold while buyers and sellers are balanced. A breakout means that balance failed: new participation is entering and price is trying to establish a direction.
Why breakouts matter
Markets spend a lot of time consolidating, with neither side able to force a trend. The break of a well-watched level is often the first sign that the negotiation is over.
Resistance is where selling has repeatedly capped price; support is where buying has repeatedly held it. Traders remember those reactions and expect them again. A breakout is those expectations breaking.
Bullish breakouts
Price clears a significant resistance: demand has overtaken supply. New longs enter and shorts cover, and that mix can accelerate the move. Common setups include the ascending triangle, bull flag and cup and handle, and three Yard Charts alerts:
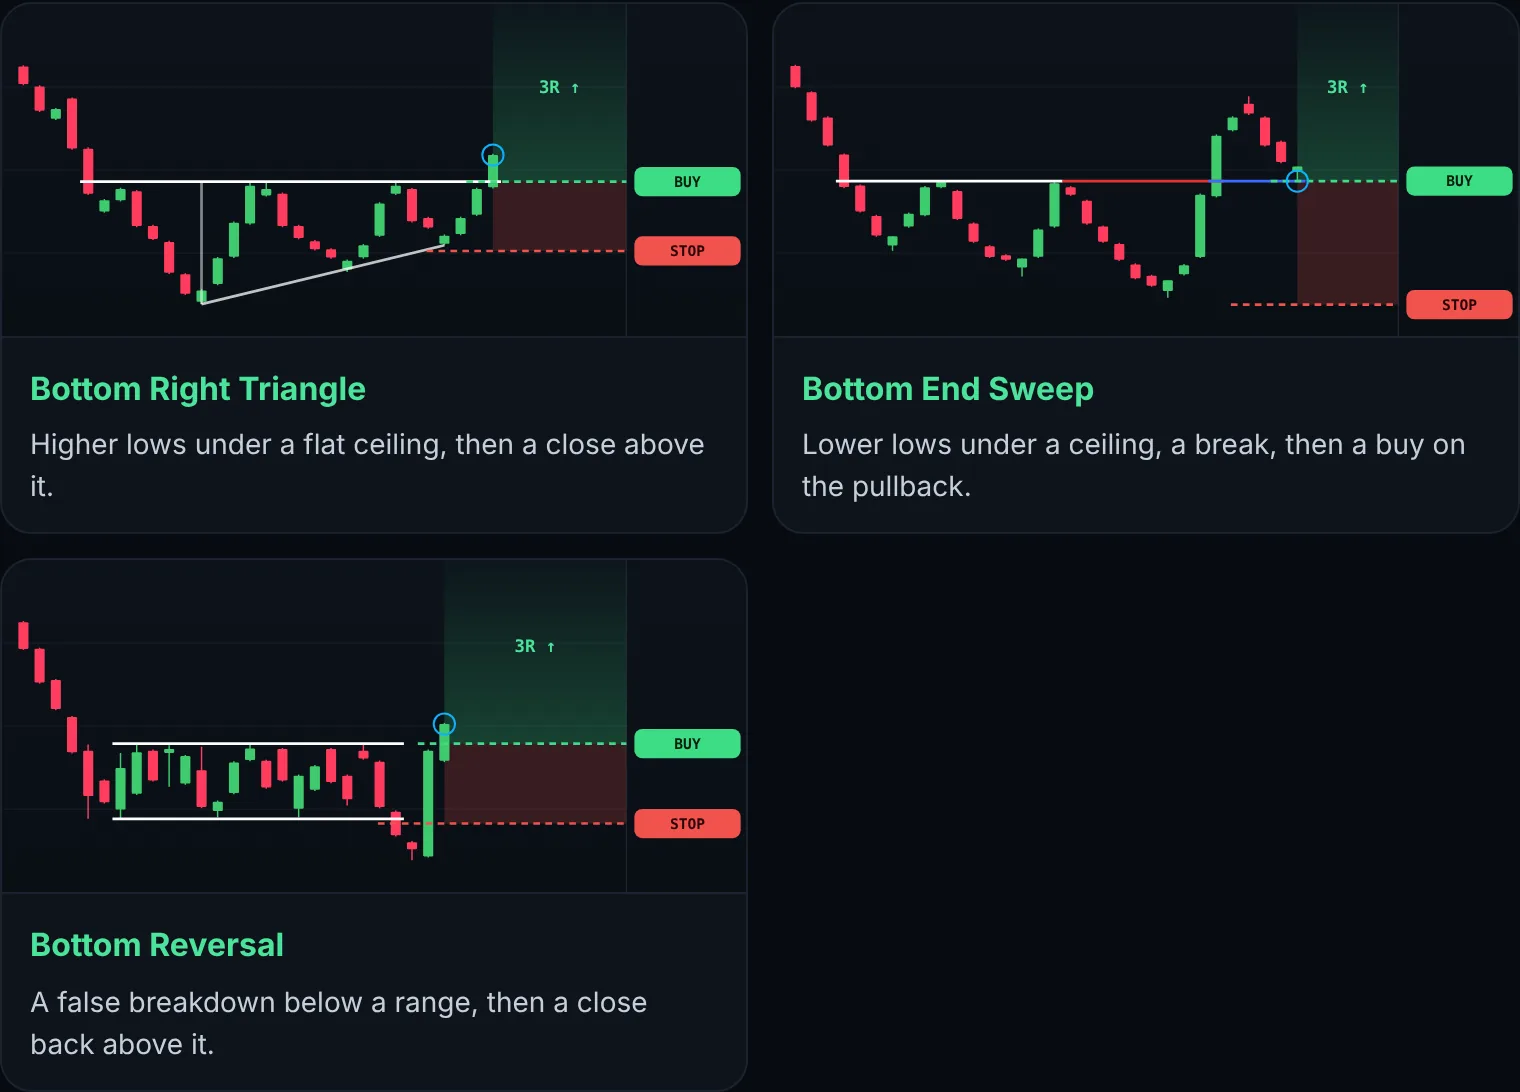
- Bottom Right Triangle: Higher lows under a flat ceiling, then a close above it.
- Bottom End Sweep: Lower lows under a ceiling, a break, then a buy on the pullback.
- Bottom Reversal: A false breakdown below a range, then a close back above it.
Bearish breakouts
Price loses a key support: sellers have control. Long stops trigger and new shorts enter, and the decline can speed up. Common setups include the descending triangle, bear flag and inverted cup and handle, and three Yard Charts alerts:
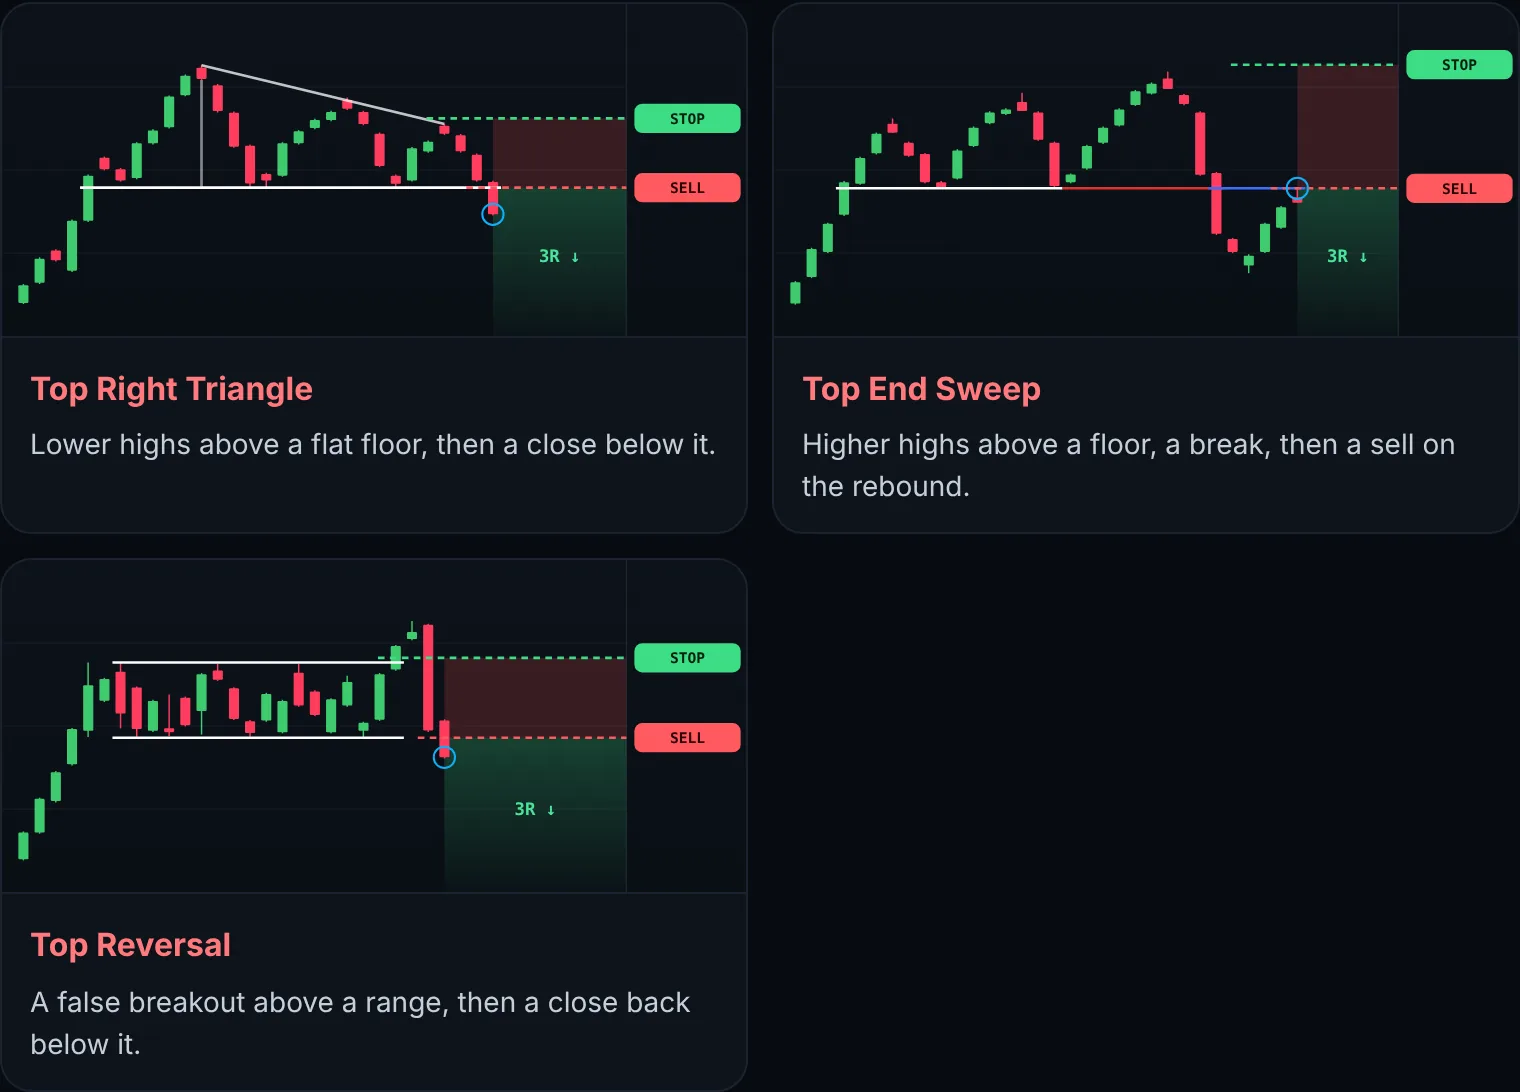
- Top Right Triangle: Lower highs above a flat floor, then a close below it.
- Top End Sweep: Higher highs above a floor, a break, then a sell on the rebound.
- Top Reversal: A false breakout above a range, then a close back below it.
Volume grades the move
A break on unusually high volume shows real participation. A break on thin volume is more likely to slip back into the range. Volume does not prove the move; it grades it.
False breakouts
Price pokes beyond the level, then closes back inside the range. These are also called fakeouts, bull traps or bear traps. They often hunt liquidity: stops clustered just beyond an obvious level get triggered, then price reverses. That is why many traders wait for more than the first print outside the level.
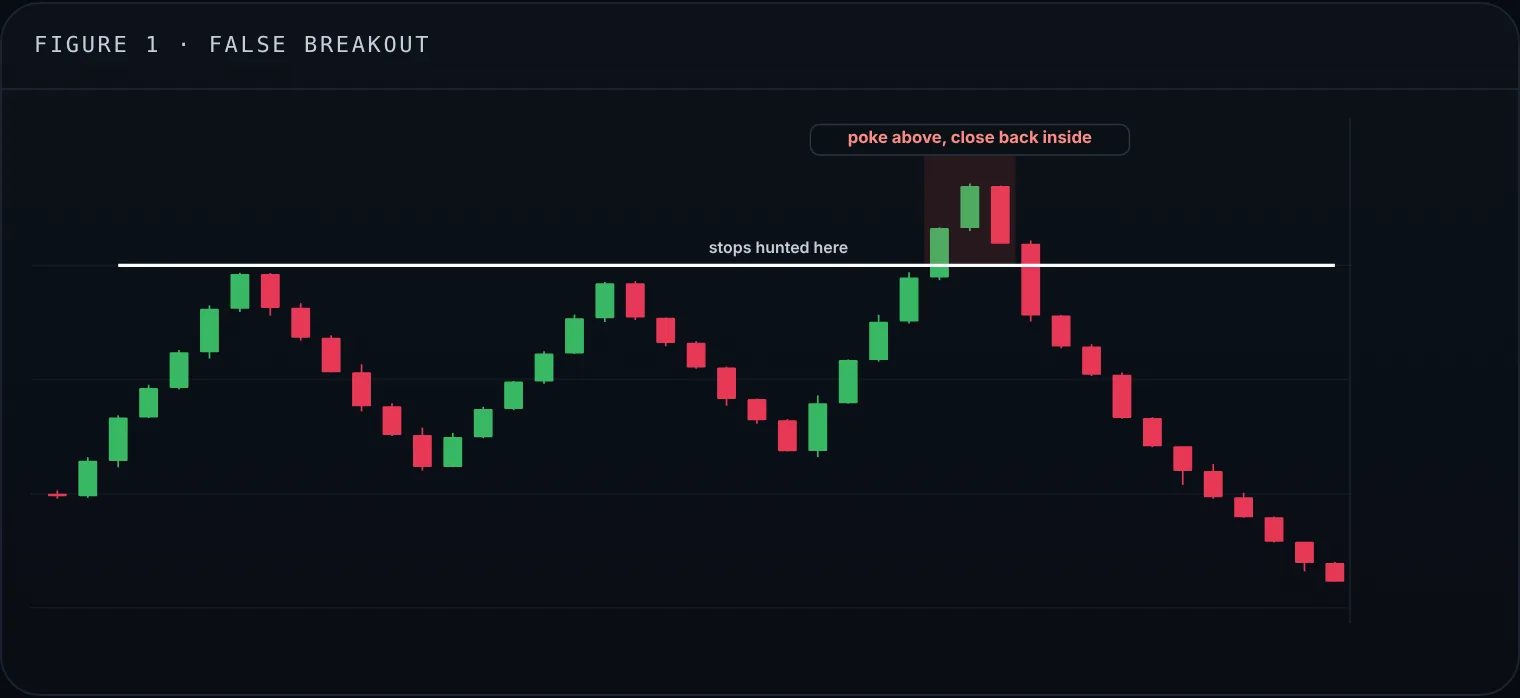
A bull trap: the poke above resistance triggers the stops sitting there, then price closes back inside and falls.
What a stronger breakout usually has
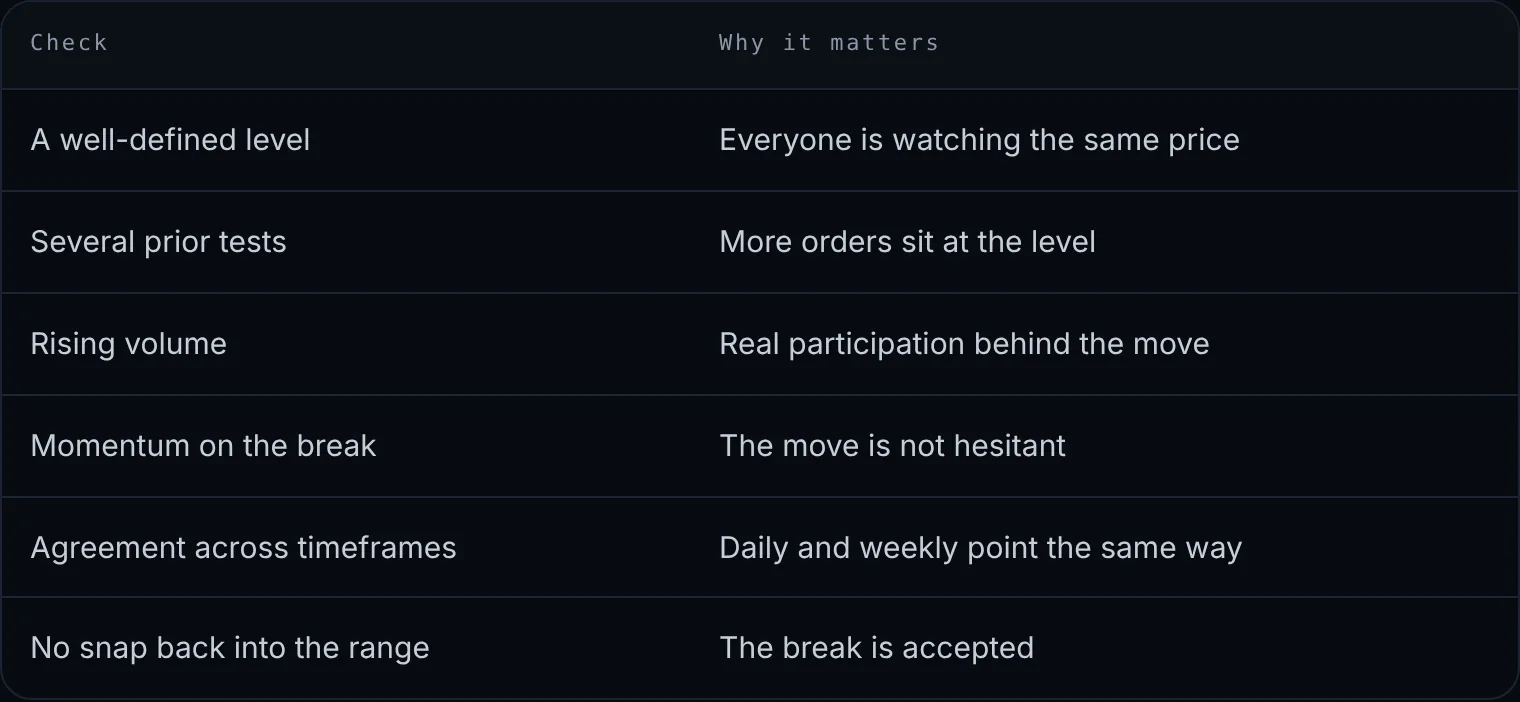
The more of these line up, the higher the odds. It is still never certain.
Enter on the break, or wait for the retest?
Aggressive entries take the close through the level. Conservative entries wait for a retest: old resistance acting as support, or old support acting as resistance. Waiting filters out false breaks but can cost part of the move. Neither method is universally better; execution and risk rules matter more than catching every break. See our illustrated article on BUY and SELL Points.
Risk
Breakouts fail. Define the stop before entry, keep size sensible, and treat a return into the range as invalidation.
Scanning
You do not need to watch thousands of charts by hand. Yard Charts monitors markets continuously and flags the pattern types above as they form. Automation narrows the list; it does not replace the decision to take the trade.
Key takeaways
- A breakout is the moment the range loses.
- Trade the ones with structure, volume and a predefined invalidation.
- Expect some to fail, and size for it.
Alerts and examples are for education only and are not investment advice. Past patterns do not guarantee future results.
Disclaimer: Yard Charts provides technical-analysis tools and alerts. It is not investment advice. Trading involves risk of loss.