On June 30, 2025, Yard Charts flagged a Bottom Right Triangle on Bitfarms (BITF). By September 12 the stock had climbed to $2.23, more than 170% above the buy level. Here is what happened, and what traders can take from it.
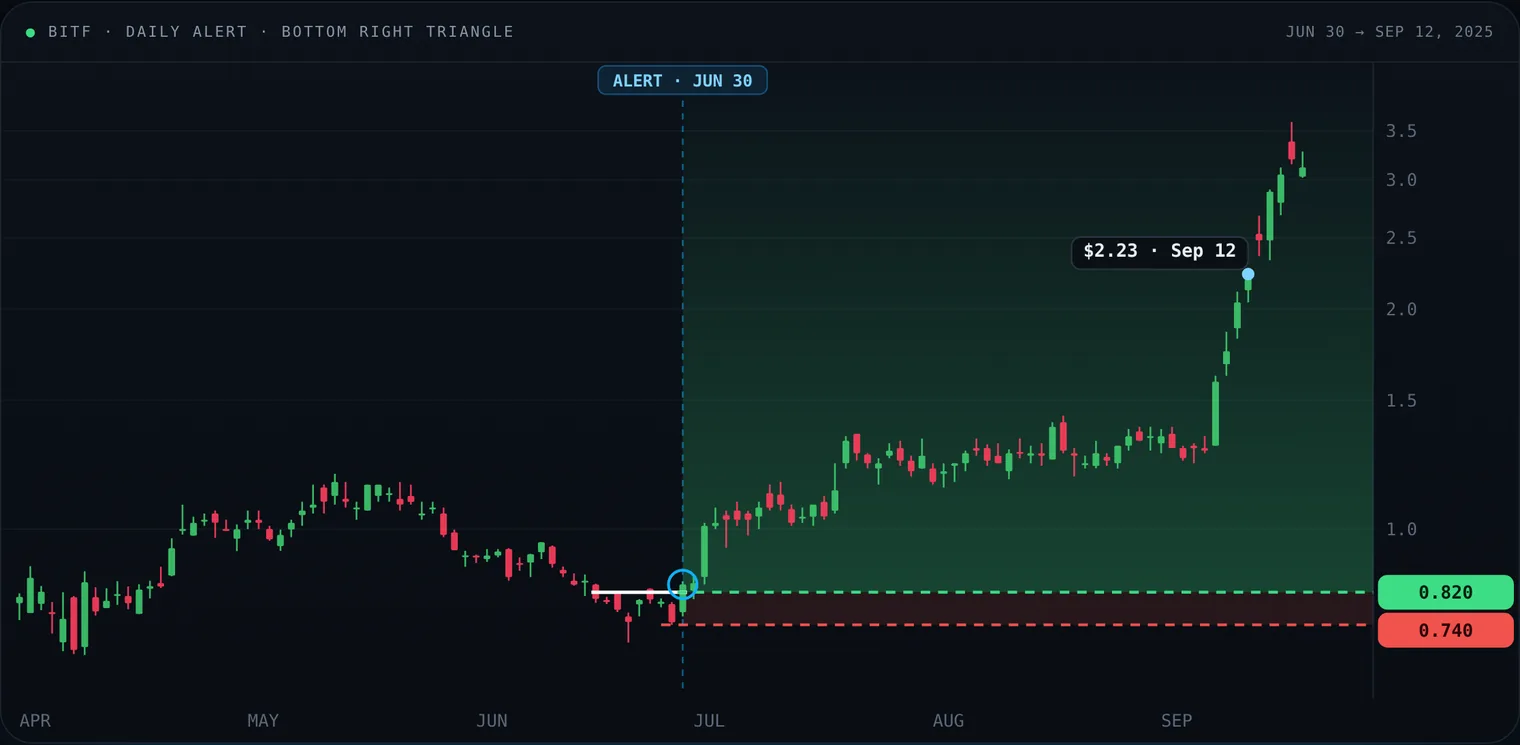
Bitfarms (BITF), daily, log scale. The alert fired on June 30 with a buy at $0.82 and a sell stop at $0.74.
- Alert: Jun 30 (2025 · daily scan)
- Buy: $0.82 (entry level)
- Sell stop: $0.74 (risk 9.8%)
- Sep 12 close: $2.23 (+172% from the buy)
From alert to rally
Chart patterns often show an opportunity before it is obvious to the market. On June 30, 2025, Yard Charts issued a Bottom Right Triangle alert on Bitfarms Ltd (BITF), flagging a possible reversal after months of consolidation. The alert set the buy at $0.82 with a sell stop at $0.74, a risk of eight cents.
Price moved through the buy within two sessions: on July 2 BITF closed at $1.01. Just over two months later, on September 12, it closed at $2.23, a gain of more than 170% from the buy level.
The Bottom Right Triangle in brief
The Bottom Right Triangle is a bullish reversal pattern. It forms after a decline or a long sideways stretch, when each dip stops at a higher low while rallies keep stalling at the same ceiling. When the sellers at that ceiling run out, price closes above it. Read the full pattern.
- A series of higher lows forms the rising side of the triangle
- The horizontal ceiling holds until buyers absorb the supply
- The break above it often comes with strong momentum
On BITF, Yard Charts detected the shape as it matured and issued the alert before the breakout gathered speed.
How the price moved
- JUN 30, 2025: Alert fires. Buy $0.82, sell stop $0.74.
- JULY – AUGUST: Price builds a base between $1.00 and $1.40, holding well above the stop.
- LATE AUGUST: Volume starts to expand, a sign of accumulation.
- SEP 9 – 12: Breakout. BITF closes at $2.23 on September 12, with an intraday high of $2.25.
What fuelled the move
The chart set the stage, and the news added fuel:
- Q2 2025 earnings: revenue of $78 million, up 87% year on year, with improving gross margins.
- Strategic expansion: a collaboration with T5 Data Centers to move into high-performance computing (HPC) and AI infrastructure, beyond Bitcoin mining.
- Sector sentiment: a rebound in Bitcoin lifted crypto-related stocks across the board.
Together they created a “fundamentals meet technicals” moment: the pattern broke out just as the company story improved.
Lessons for traders
Lessons
- Respect high-probability patterns. Yard Charts focuses on a small set of proven formations; use the alerts as early warnings.
- Combine charts and fundamentals. The biggest moves come when a bullish setup lines up with company news or sector tailwinds.
- Always define the risk. The alert came with a stop at $0.74. However strong the setup, the stop is not optional.
- Watch the volume. Expanding volume confirmed that the breakout had real participation.
Final thoughts
The June 30 alert on BITF shows the value of pairing automation with discipline. The scanner spotted the setup well before the wider market, and the fundamentals supplied the fuel. Use tools that surface high-probability setups, and confirm every trade with a stop and the market context.
Alerts and examples are for education only and are not investment advice. Past patterns do not guarantee future results. Price data: daily OHLC from Yahoo Finance. Alert levels are those published by Yard Charts. Bitfarms now trades on Nasdaq as Keel Infrastructure (KEEL); the chart uses that price history.
Disclaimer: Yard Charts provides technical-analysis tools and alerts. It is not investment advice. Trading involves risk of loss.