Rezolve AI (RZLV) Breakout: How YardCharts’ 8/29 Alert Captured a Clean Bottom Right Triangle
Some breakout signals are not loud; they just build pressure in the background. On August 29, 2025, Yard Charts detected one on Rezolve AI. What followed was one of the strongest rallies in AI-powered retail tech.
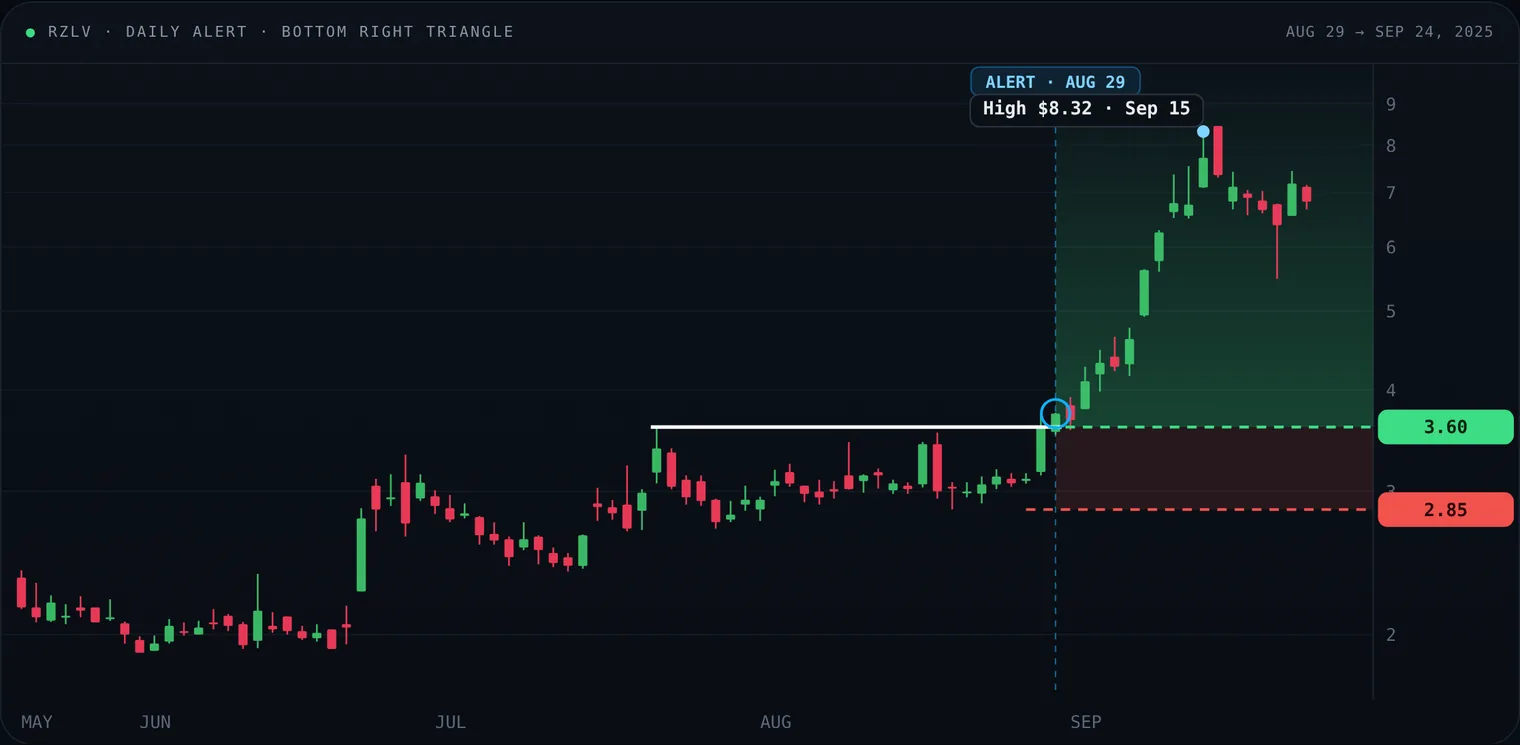
Rezolve AI (RZLV), daily, log scale. Buy $3.60, sell stop $2.85. The stock reached a high of $8.32 on September 15.
- Alert: Aug 29 (2025 · daily scan)
- Buy: $3.60 (entry level)
- Sell stop: $2.85 (risk 20.8%)
- Sep 15 high: $8.32 (+131% from the buy)
From alert to momentum
On August 29, Yard Charts raised a Bottom Right Triangle alert on Rezolve AI (RZLV), with the buy at $3.60 and the sell stop at $2.85. The structure pointed to a bullish reversal: higher lows under a horizontal river line, repeated tests of that ceiling, and a breakout in preparation.
In the sessions after the alert, price held just above the river line, then broke away. What had looked like compression turned into force: RZLV climbed steadily on rising volume, closing at $6.25 on September 10 and touching $8.32 on September 15.
Who is Rezolve AI
Rezolve AI PLC describes itself as a generative-AI solutions provider for retail and e-commerce. It gives brands, retailers and manufacturers tools for smarter product discovery and engagement, such as visual search and recommendations.
From the $3.60 buy, the share price crossed into the $6–7 range by mid-September, a gain of roughly 80–100% depending on the close you take. Volume picked up noticeably, reflecting growing institutional and retail interest.
Fundamental drivers
- Less share overhang: reducing dilution concerns helped build investor confidence.
- Rising institutional ownership, according to public filings.
- Sector tailwinds: AI is increasingly central to retail technology, and RZLV fits that narrative.
Lessons for traders
Lessons
- Respect structure and confirmation. Clear resistance, ascending lows and a close above the horizontal.
- Align fundamentals with the signal. The business story and a cleaner share structure amplified the breakout.
- Define the risk. The $2.85 stop gave a clear point where the trade fails.
- Look for volume. Rising volume on the break reduced the chance of a false breakout.
Final thoughts
Rezolve AI’s surge after the August 29 alert is a textbook example of structure, fundamentals and sentiment lining up. The pattern did not just show prices compressing; it hinted at latent demand. When that demand arrived, price followed. How the Bottom Right Triangle works.
Alerts and examples are for education only and are not investment advice. Past patterns do not guarantee future results. Price data: daily OHLC from Yahoo Finance. Alert levels are those published by Yard Charts.
Disclaimer: Yard Charts provides technical-analysis tools and alerts. It is not investment advice. Trading involves risk of loss.