IREN’s Four-Month Rally: How a Yard Charts Alert Spotted the Bottom Right Triangle Early
Markets reward patience, and they reward preparation. In May 2025, a quiet formation on Iren Limited (IREN), what Yard Charts classifies as a Bottom Right Triangle, signalled that accumulation was under way. What followed was one of the year’s strongest rallies.
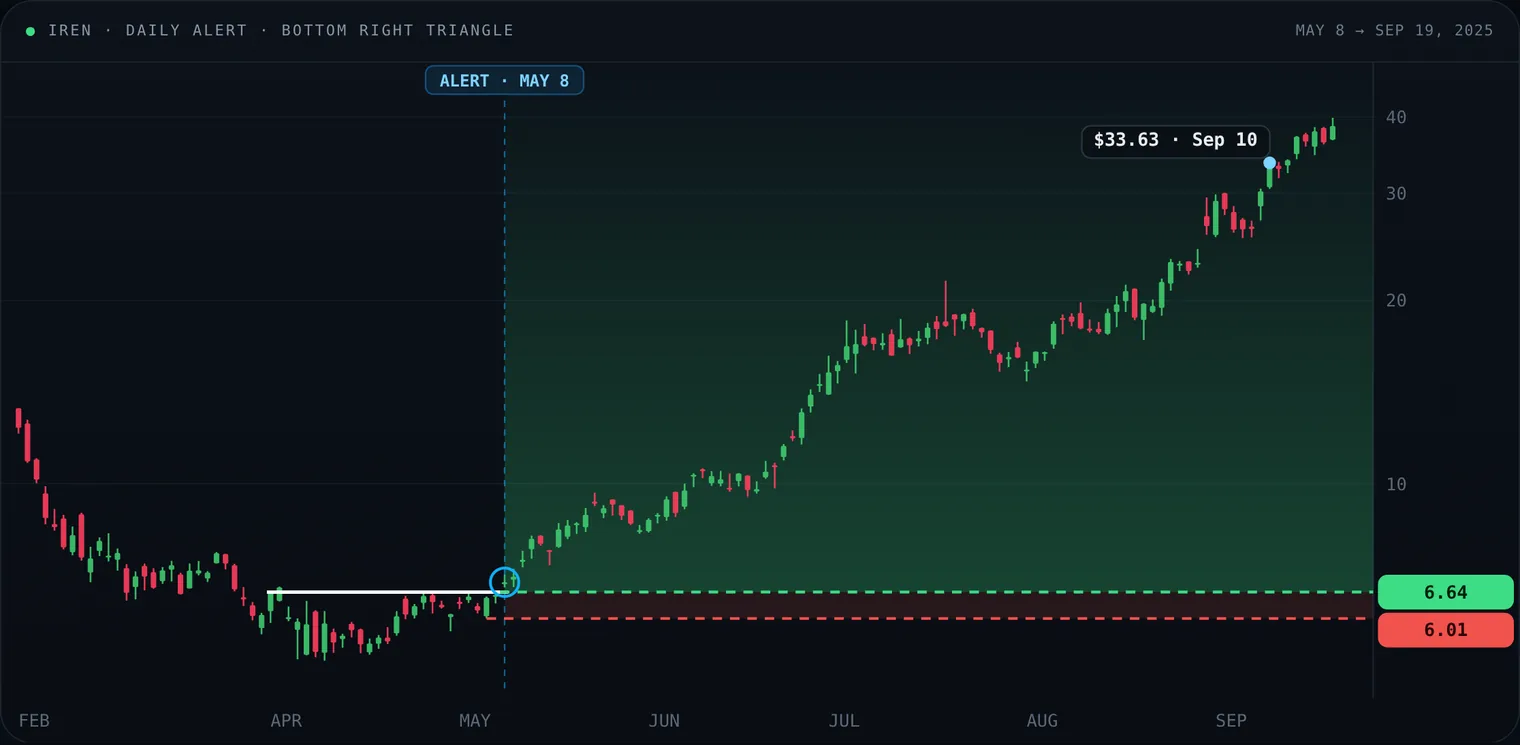
IREN, daily, log scale. Alert on May 8 with the buy at $6.64 and the sell stop at $6.01. By September 10 the stock closed at $33.63.
- Alert: May 8 (2025 · daily scan)
- Buy: $6.64 (entry level)
- Sell stop: $6.01 (risk 9.5%)
- Sep 10 close: $33.63 (about 5× the buy)
From alert to rally
On May 8, 2025, Yard Charts detected a Bottom Right Triangle on Iren Limited (IREN), with the buy at $6.64 and the sell stop at $6.01. The river line sat at the April highs; each dip since late March had stopped higher.
Over the next four months IREN climbed past $30, a multi-bagger for traders who acted on the signal.
The pattern
The Bottom Right Triangle often forms after a period of weakness. Higher lows squeeze price against a horizontal ceiling until buyers absorb the supply; once volume expands, the pattern tends to resolve with a sharp move up. Flagging it in May gave traders an early entry, before the rally gathered momentum.
Four months of price action
- MAY 8: Alert fires near $6.64.
- JUNE – JULY: Steady strength and higher lows as interest builds; the stock passes $15 in early July.
- AUGUST: The advance accelerates; momentum carries price relentlessly higher.
- SEPTEMBER: IREN crosses $30, closing at $33.63 on September 10: about five times the alert level.
Fundamental drivers
The chart told one story; the company’s developments added the push. Iren reported strong year-on-year revenue growth with healthier margins and cash flow. It made major progress on a GPU-backed AI cloud, deploying thousands of high-end processors for high-performance computing, and became a recognised Nvidia Preferred Partner.
As a significant Bitcoin miner, Iren also benefited from the cryptocurrency’s rebound. Together these drivers let the breakout evolve into a four-month trend.
Lessons for traders
Lessons
- Trust proven patterns. The Bottom Right Triangle has a history of strong follow-through when volume confirms.
- Combine technicals with fundamentals. The biggest moves come when a breakout meets company or sector tailwinds.
- Risk management first. The $6.01 stop let traders take part without overexposure.
- Use volume as confirmation. Surging activity signalled conviction behind the move.
Final thoughts
IREN’s rally shows how pattern-based alerts can surface opportunities early, well before the wider market notices, and how a setup can unfold over weeks and months rather than days. Read the pattern.
Alerts and examples are for education only and are not investment advice. Past patterns do not guarantee future results. Price data: daily OHLC from Yahoo Finance. Alert levels are those published by Yard Charts.
Disclaimer: Yard Charts provides technical-analysis tools and alerts. It is not investment advice. Trading involves risk of loss.