Price forms shapes that repeat. Those shapes are chart patterns. They map the balance between buyers and sellers. They do not guarantee the next move; they give context.
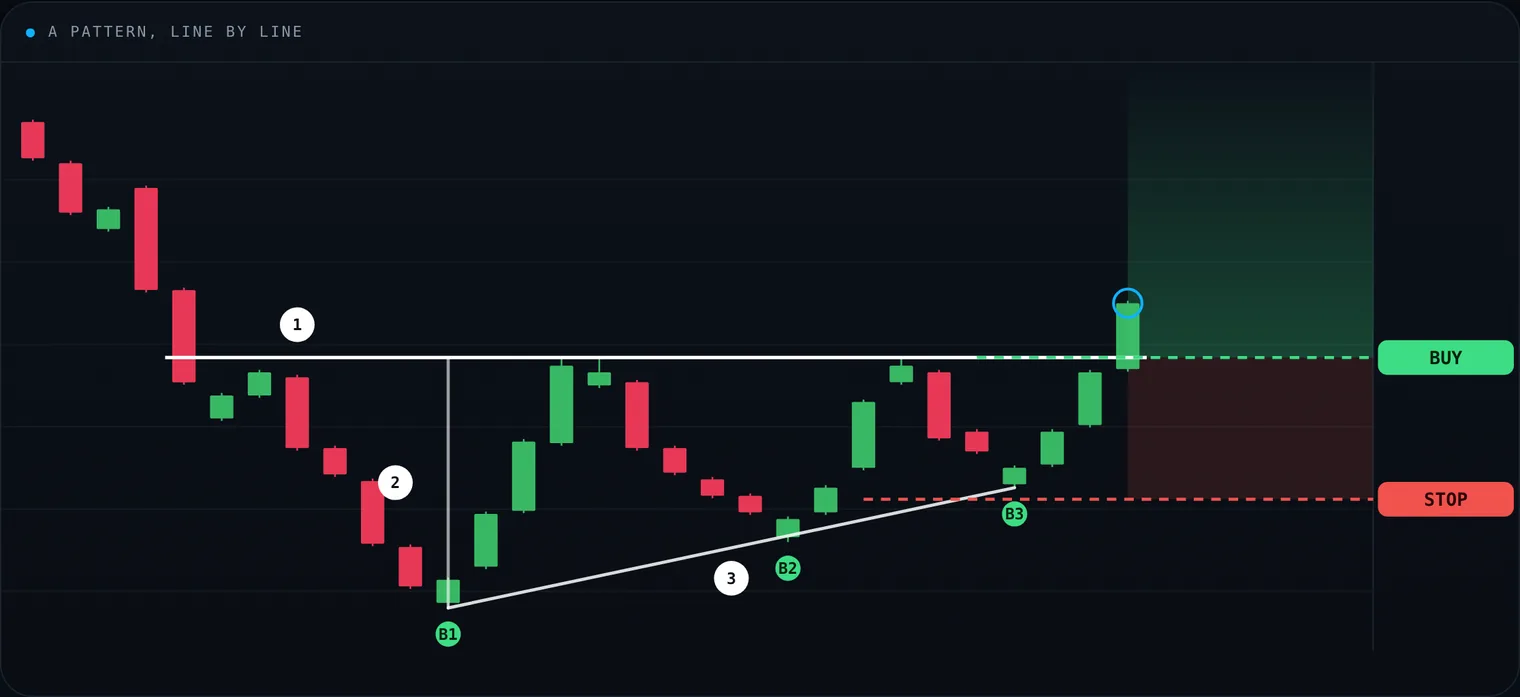
One of the eight Yard Charts patterns, the Bottom Right Triangle: a flat ceiling, rising lows, and a buy on the close above the line.
The same formations show up in stocks, crypto, forex, commodities and indices, and on more than one timeframe.
Why patterns repeat
Markets are human decisions stacked on a chart. Buying on strength and selling on fear leave geometry behind. A burst of demand leaves a run; when it is spent, price stalls or retraces into a flag, pennant, triangle or range. Supply does the same on the way down. Failed new highs or lows leave double tops, double bottoms and shoulders. Stops beyond an obvious level get taken, then price snaps back: a sweep.
- 1 · Impulse: A burst of demand or supply.
- 2 · Pause: A flag, range or triangle.
- 3 · Test: A level is probed.
- 4 · Resolve: A break or a reversal.
That order-flow sequence keeps returning, so the same shapes keep showing up.
John Murphy’s line still holds: price discounts the available information. News, expectations and sentiment are already in the print. Patterns read that print; they are inferences, not forecasts.
Stanley Druckenmiller used charts the same way. In his 2009 fireside chat with Jeff Feig he said he would not start a position if the chart was wrong, and that a turn on the chart sometimes came first, giving him time to build the case before the fundamentals caught up. The chart was a check before starting work on a trade, not a standalone order.
Three categories
Reversal: the active trend may be ending
- Head and shoulders
- Bottom and Top Right Triangles (Yard Charts)
- Bottom and Top End Sweeps (Yard Charts)
- Bottom and Top Reversals (Yard Charts)
- Triple bottoms and tops
- Bullish and bearish consolidation triangles
- Wedges
- Breaks of bottom and top ranges
Continuation: the trend pauses, then is likely to resume
- Bull and bear flags
- Bullish and bearish cups
- Bullish and bearish pennants
- Horizontal Pullbacks and Horizontal Retracements within a trend (Yard Charts)
- In-trend consolidating triangles
- In-trend wedges
- In-trend fading triangles
Bilateral: no side is favoured until price leaves a key level
Ranges are the usual case. Some are flat; some slope slightly.
The eight Yard Charts patterns
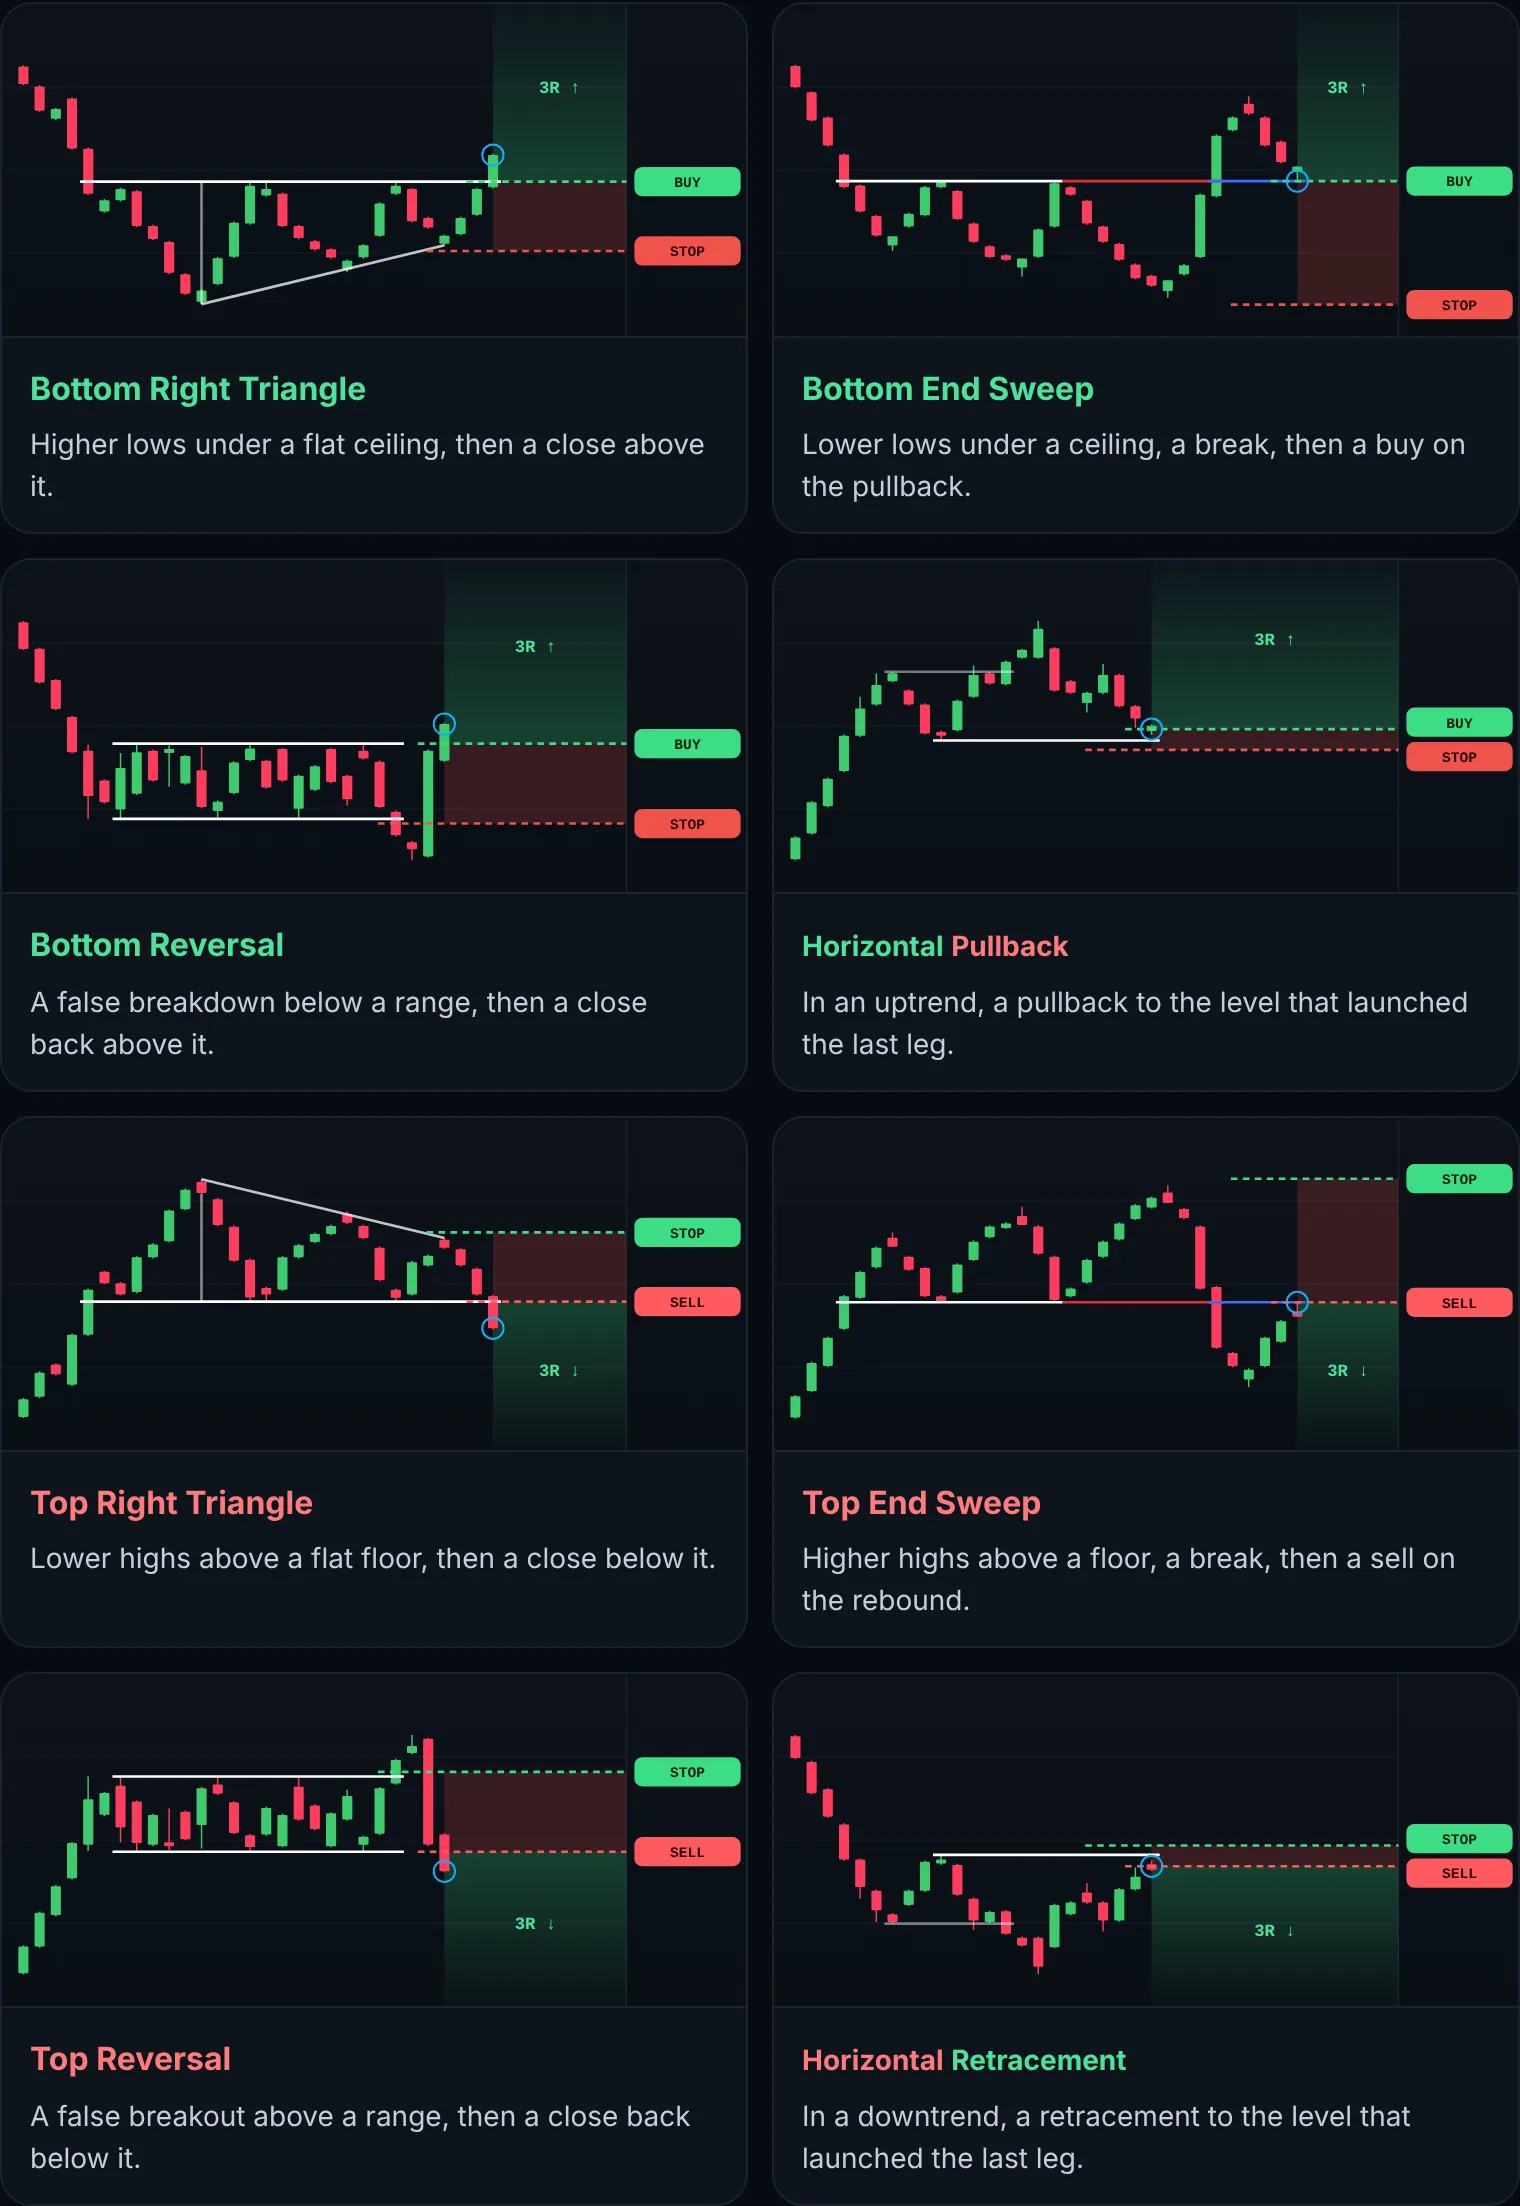
- Bottom Right Triangle: Higher lows under a flat ceiling, then a close above it.
- Bottom End Sweep: Lower lows under a ceiling, a break, then a buy on the pullback.
- Bottom Reversal: A false breakdown below a range, then a close back above it.
- Horizontal Pullback: In an uptrend, a pullback to the level that launched the last leg.
- Top Right Triangle: Lower highs above a flat floor, then a close below it.
- Top End Sweep: Higher highs above a floor, a break, then a sell on the rebound.
- Top Reversal: A false breakout above a range, then a close back below it.
- Horizontal Retracement: In a downtrend, a retracement to the level that launched the last leg.
Context
A shape alone is not a trade. Check the larger trend, volume, support and resistance, momentum, risk-to-reward and the tape around it. A bull flag in a clean uptrend is not the same trade as the same shape in a weak, choppy market.
Finding setups
Thousands of stocks and coins print every day. Hand-scanning is slow, and useful patterns often finish while the search is still running. Yard Charts scans stocks and crypto on fixed technical rules. When a setup qualifies, the alert names the pattern and shows a potential entry and stop. The scan narrows the list; it does not take the trade.
Risk
News, earnings and macro data can kill a valid-looking pattern. Size the position, place the stop, set the target, and keep the same rules after a loss. No pattern works every time.
Key takeaways
- Read the structure first.
- Use the scan to find it faster.
- Take only setups that still make sense with trend, level and risk defined.
Alerts and examples are for education only and are not investment advice. Past patterns do not guarantee future results.
Disclaimer: Yard Charts provides technical-analysis tools and alerts. It is not investment advice. Trading involves risk of loss.