A candlestick shows how price traded in one period: a minute, an hour, a day, a week or a month. Four prices define it: open, high, low and close (OHLC).
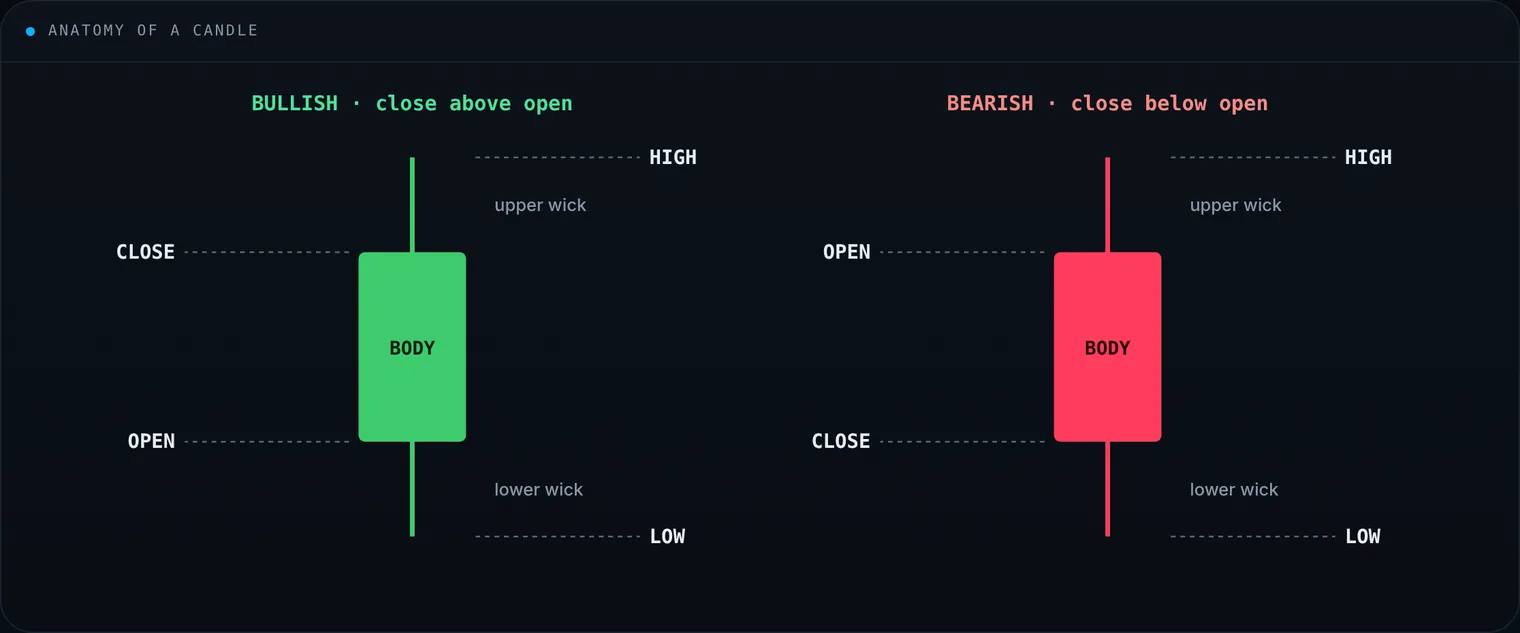
The body spans open to close; the wicks mark the extremes. Green and red are the usual colours, though platforms vary.
Structure
- Body: the distance between open and close. Close above open is a bullish candle; close below open is bearish.
- Wicks (shadows): the extremes of the period. The upper wick reaches the high, the lower wick the low.
Body versus wick is the useful part: who pushed, and who pushed back.
What candles add
A line chart shows only the close. A candle shows momentum, pressure and range in the same bar. That is why candles sit under most technical work, including every Yard Charts alert chart.
What a single candle says
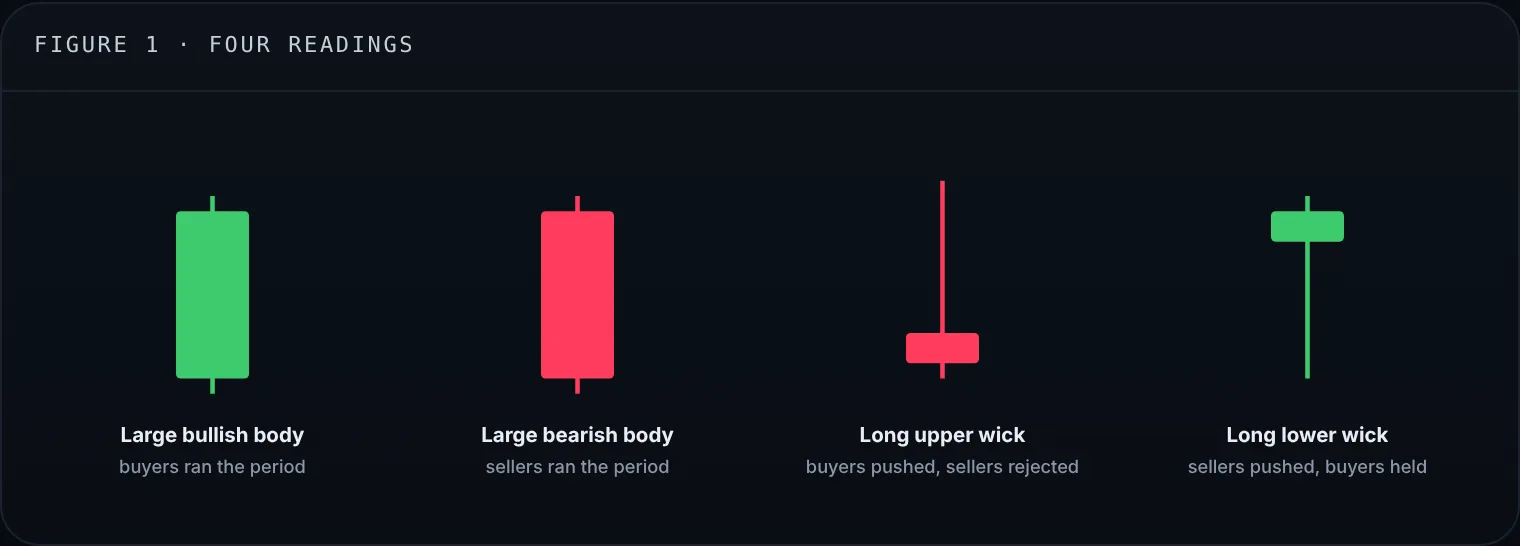
One candle is one session. A sequence of candles is the trend, the pause or the turn.
Timeframes
The reading does not change with the clock; only the amount of activity inside the bar does. Intraday traders use short bars, swing and position traders use daily and weekly. See Time interval and Liquidity for how Yard Charts builds daily and 60-minute bars.
Single bars vs. patterns
One candle is data; groups of candles are setups. Common ones include the doji, hammer, shooting star, engulfing, morning star, evening star and harami. No pattern forecasts the next bar on its own. Use it with trend, support and resistance, volume and a stop.
Key takeaways
- Candles work on stocks, crypto, forex and commodities because they only report OHLC.
- Read the body and the wicks first, then read the sequence.
Alerts and examples are for education only and are not investment advice. Past patterns do not guarantee future results.
Disclaimer: Yard Charts provides technical-analysis tools and alerts. It is not investment advice. Trading involves risk of loss.