Choosing the right time interval and understanding liquidity can sharpen your strategy. Here is how Yard Charts builds its bars, and how it measures market depth to help reduce risk and improve execution.
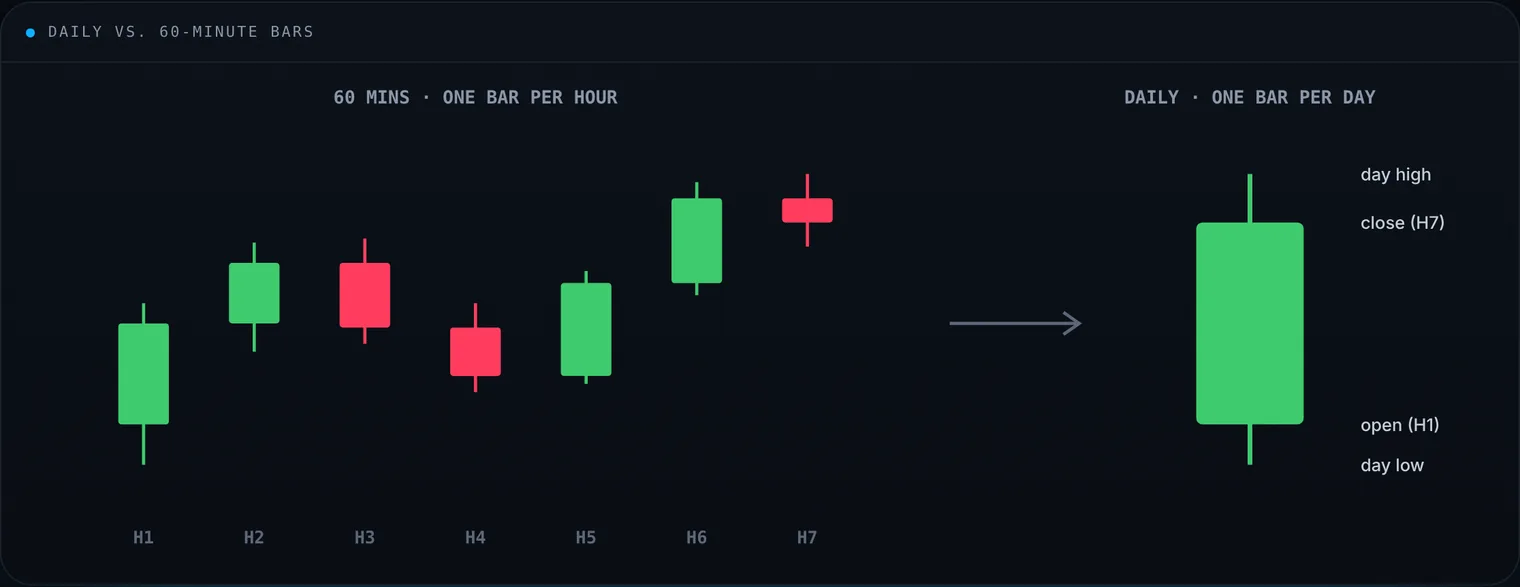
Seven hourly bars and the single daily bar they make: same open, same close, same high and low.
Choosing an interval
Selecting an interval is fundamental. It sets the time granularity of your analysis: how data points are captured and how the chart is drawn.
Daily
- Each bar holds a full trading day: open, high, low, close and volume
- The chart builds day by day
- Available on every plan
60 mins
- Each bar holds one hour (60 minutes) of OHLC and volume
- The chart builds hour by hour
- Premium: 60 US ETFs, 90 US stocks, 90 crypto, 30 forex pairs
Liquidity decoded
Liquidity is the lifeblood of trading: it decides how easily, and how cheaply, you can get in and out. Yard Charts looks at two things:
- Bid-ask dynamics: the width of the spread between what buyers will pay and what sellers will accept.
- Market depth: how much volume is available at each price level, which affects the execution of larger orders.
High liquidity
- Lower risk: you can trade size without moving the price much
- There is always a market to deal with
- Stops fill close to their level
Low liquidity
- More volatility: small orders move price a lot
- Exits can slip badly, especially stop orders
- Wider spreads raise the cost of every trade
How Yard Charts measures it
Yard Charts uses its own formula to measure how much capital it takes to move a stock’s or a crypto’s price by a set percentage. The result is the liquidity ratio: high figures for the most liquid names, such as the Dow 30, down to minimal values for thinly traded penny stocks. Every alert shows it, together with a grade.
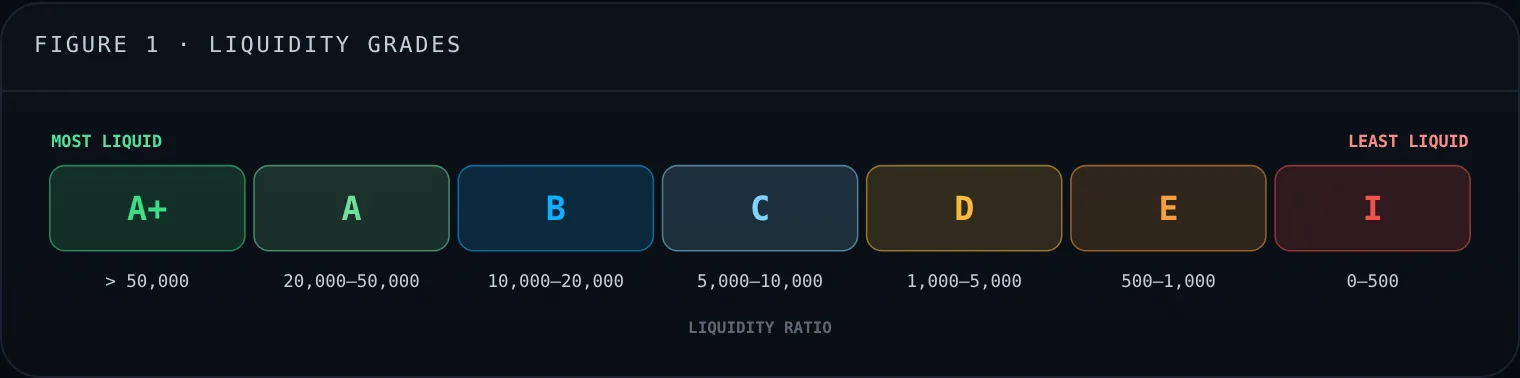
The seven liquidity grades, from A+ (most liquid) to I (least liquid).
Liquidity classification table
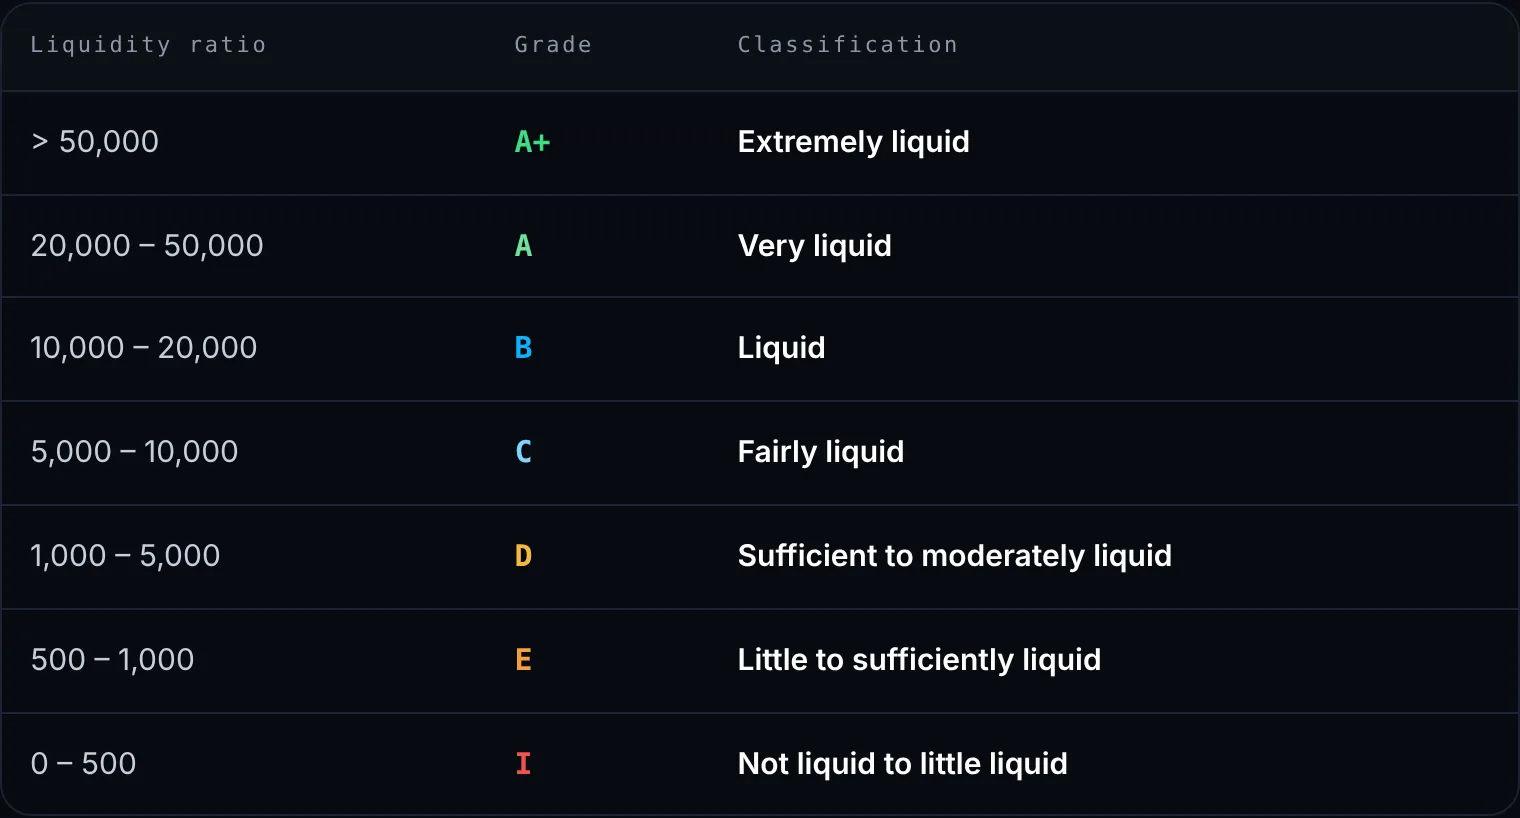
Why it matters for your stop. On a thin, I-grade name a stop can fill well below its level. Size smaller, or prefer A to C grades for tight setups.
Alerts and examples are for education only and are not investment advice. Past patterns do not guarantee future results.
Disclaimer: Yard Charts provides technical-analysis tools and alerts. It is not investment advice. Trading involves risk of loss.