A bull trap pattern is a deceptive chart formation where an asset's price briefly penetrates a key resistance level—triggering breakout buy orders—before abruptly reversing downward into an aggressive decline. This false breakout leaves bullish traders trapped in losing long positions at the absolute peak of the move, as overhead selling momentum overwhelms remaining demand.
Active traders frequently wonder why an asset suddenly collapses immediately after clearing a prominent multi-week resistance ceiling. In modern auction market mechanics, this sequence is rarely accidental. Rather than indicating an organic influx of institutional accumulation, it often represents a deliberate liquidity sweep where aggressive retail buying power is absorbed by patient institutional distribution.
Recognizing the structural warning signs of an impending false breakout protects your capital from severe drawdowns. Understanding how quantitative top reversal formations develop allows traders to avoid emotional whipsaws, identify market exhaustion early, and execute structured short setups following pattern invalidation.
Market Mechanics: Liquidity Sweeps and Distribution at Resistance
Large market participants face structural liquidity constraints when managing institutional capital. Executing large sell orders during low-volatility conditions creates severe negative slippage. To liquidate long positions or build short exposure without depressing prices, sellers rely on counter-party liquidity pools—concentrations of resting orders above technical levels.
On classical charts, the thickest concentration of buy liquidity sits directly above horizontal resistance lines:
- Breakout Buy Stops: Traders placing pending market orders to buy once resistance is breached.
- Short Stop-Losses: Pre-existing short sellers placing buy-stop orders above resistance to cap risk.
Institutional distribution exploits this order clustering across three phases:
- Phase 1: The Push (Incentive): Aggressive buying nudges price action marginally above resistance, triggering the cluster of resting buy-stop orders.
- Phase 2: The Absorption (Liquidity Sweep): As breakout buyers flood the market, institutional sellers fill large limit sell orders into this surge, absorbing demand without letting price advance further.
- Phase 3: The Collapse (The Trap): With resting buy orders exhausted, bids evaporate. Price drops sharply back inside the consolidation range, trapping breakout buyers whose stop-losses subsequently accelerate downside momentum.
These dynamics form the foundation of quantitative Top Reversal pattern rules and clarify breakout failures and whipsaws.
Visual Anatomy: Candlestick Rejections and Volume Signatures
While engineered liquidity grabs can deceive traders who rely solely on price levels, their physical footprint is recorded on candlestick charts through three markers:
- Prominent Upper Rejection Wicks: Candlestick formations like shooting stars or pinbars—where an upper shadow accounts for over 60% of the candle's range—signal aggressive rejection of higher prices.
- Failure to Sustain the Session Close: A breakout candle that spikes through resistance intraday but closes back below the ceiling demonstrates that buyers lack the conviction to establish accepted value.
- Volume Exhaustion Divergence: Price pushes to a fresh nominal high on declining volume, indicating that resting stops—not expanding institutional demand—drove the move.
Comparing these signatures against volume moving averages helps traders distinguish genuine institutional accumulation from temporary distribution sweeps.
Bull Trap vs. Genuine Breakout: Key Structural Divergences
Distinguishing between a high-probability breakout and an impending bull trap requires an objective comparison of auction characteristics:
| Evaluation Metric | Genuine Breakout | Bull Trap (False Breakout) |
| Breakout Volume | Heavy expansion (1.5x to 2x the 20-day average) | Below-average volume or a single spike that dries up immediately |
| Candle Close Location | Decisive close firmly above resistance in top third of candle range | Candle wicks above resistance but closes back inside the range |
| Retest Dynamics | Pullback to prior resistance holds firmly on low volume | Price slices through support with heavy volume and high velocity |
| Follow-Through Velocity | Consecutive expanding bullish candles sustaining the advance | Immediate bearish reversal candle invalidating the breakout |
| Market Breadth | Sector ETFs and peer stocks confirm the upward advance | Single-stock spike diverging negatively from broader indices |
When structural evidence points to distribution rather than accumulation, traders should stand aside or prepare for a tactical reversal setup.
The Yard Charts Top Reversal Framework: Quantifying the Bull Trap
Rather than merely avoiding bull traps, quantitative traders exploit them as structured short-selling opportunities. On Yard Charts, failed breakouts are quantified into the Bearish Flag - Top Reversal formation, which belongs to Yard Charts' Bearish Flag pattern family.
The Top Reversal eliminates emotional guesswork through four objective geometric stages, precise invalidation parameters, and strict momentum velocity criteria:
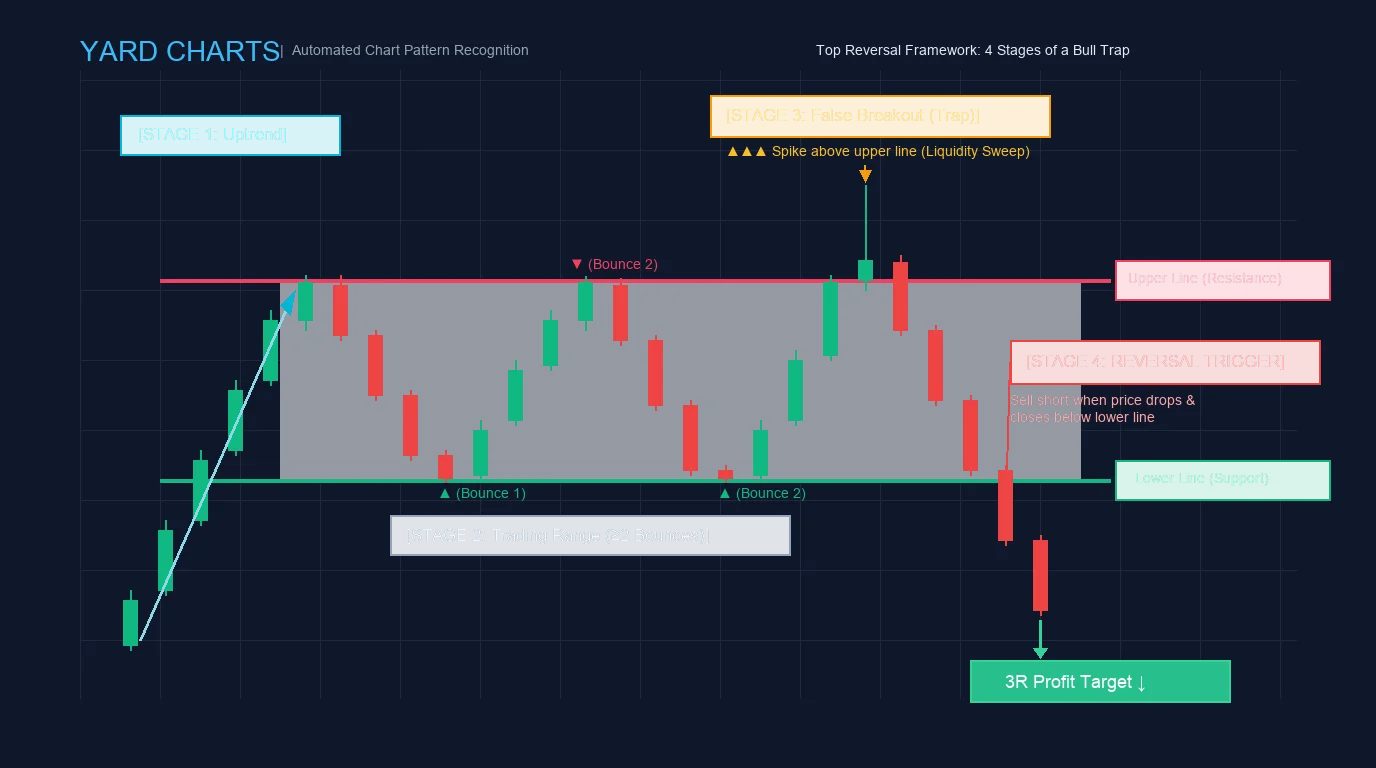
The 4 Structural Stages of a Top Reversal
- Stage 1 (Context - Uptrend): A sustained upward advance must precede the formation, ensuring the asset is extended and retail market participants are primed with bullish sentiment.
- Stage 2 (Pause - Horizontal Trading Range): The advance pauses into a horizontal consolidation bounded by an Upper Line (Resistance) and a Lower Line (Support), requiring ≥2≥2 valid bounces off both boundaries to verify structural equilibrium.
- Stage 3 (The Trap - False Breakout): Price pushes above the Upper Line, printing a nominal higher high. This spike triggers buy-stop liquidity and entices breakout buyers, but fails to sustain value above the ceiling.
- Stage 4 (Reversal - Downside Trigger): Price reverses sharply back inside the range, slicing through consolidation and printing a confirmed candle body close below the Lower Line. This confirmed close below the lower boundary serves as the official, non-negotiable short entry trigger.
Invalidation and Risk Management Rules
- Entry Execution: Traders do not short prematurely while price wicks above the Upper Line in Stage 3. The short trade is initiated exclusively upon a confirmed candle close below the Lower Line in Stage 4.
- Stop-Loss Placement (Short Position): The protective buy stop is placed strictly above the Upper Line of the range or above the recent swing high formed by the Stage 3 trap spike. If price recovers and breaches this high, the bearish thesis is invalidated.
- Velocity Invariant (Momentum Rule): The time price takes to ascend to the new swing high in Stage 3 must be less than or equal to the time it took to decline (
Ascent Time to New High <= Descent Time). This velocity filter confirms that the upward move was an unsustainable speculative spike. - Profit Target Projection: The standard primary profit objective is calibrated to a 3R reward-to-risk ratio, measured downward from the lower line breakdown level using the height of the consolidation range.
Yard Charts Top Reversal Trade Execution Matrix
| Setup Component | Specification | Operational Protocol |
| Market Direction | Bearish Reversal / Tactical Short | Triggered after extended uptrend exhaustion |
| Consolidation Filter | Horizontal Range (≥2≥2 Bounces) | Both Upper Line and Lower Line require ≥2≥2 verified contact points |
| Trap Validation | Piercing of Upper Line | High exceeds Upper Line without printing consecutive closes above |
| Velocity Rule | Ascent Time ≤≤ Descent Time | Validates rapid speculative exhaustion |
| Official Entry Trigger | Candle close below Lower Line | Short entered immediately following verified close |
| Defensive Stop-Loss | Placed above Upper Line / Spike High | Caps risk; invalidates the bearish structure if broken |
| Primary Profit Target | 3R Risk-Reward Objective | Projected downward based on structural range dimensions |
| Early Invalidation | Close back inside range after breakdown | Exit trade immediately if breakdown fails to expand downward |
Bull Trap vs. Bear Trap: Core Differences
While both patterns represent false breakout mechanics, their market orientation is diametrically opposed:
- Bull Trap (Top Reversal): Price breaks upward above resistance, lures buyers into long positions at the top of an uptrend, and abruptly collapses into a downward trend.
- Bear Trap (Bottom Reversal): Price breaks downward below support, lures short sellers into entering at the bottom of a downtrend, and snaps violently upward into a short squeeze.
Understanding whether price is testing a resistance ceiling or support floor dictates whether traders should defend capital or prepare for a tactical short-side expansion.
Common Mistakes When Trading Bull Traps
Navigating bull traps requires disciplined execution. Traders frequently encounter losses by making fundamental errors:
- Shorting Preemptively at the Upper Line: Entering short while price wicks above the upper line in Stage 3 is dangerous because genuine breakouts often accelerate rapidly. Always wait for the confirmed Stage 4 close below the lower boundary.
- Neglecting the Minimum Bounce Rule: A valid trading range requires at least ≥2≥2 verified bounces on both upper and lower lines. Trading unconfirmed consolidation often leads to whipsaws.
- Placing Stop-Losses Inside the Range: Placing a stop-loss inside the range exposes the trade to intra-range noise. Protective buy stops must sit cleanly above the Upper Line or trap high.
- Ignoring Broader Market Regimes: Shorting an isolated stock when broader market indices are in a powerful breakout reduces downside follow-through. Always verify market context before executing.
Automated Top Reversal Detection with Yard Charts
Screening hundreds of candlestick charts manually to identify multi-week distribution ranges is mentally exhausting and susceptible to emotional bias.
Yard Charts eliminates subjective guesswork through quantitative pattern recognition across 13,000+ stocks, ETFs, forex pairs, and cryptocurrencies scanned daily, alongside automated 60-minute interval scans for liquid tickers:
- Top Reversal Detection: Automatically scans for the 4-stage reversal sequence, validating the prior uptrend, horizontal range bounces, upper-line trap spike, and confirmed breakdown close below support.
- Top End Sweep Algorithms: Identifies rapid liquidity sweeps where prices temporarily pierce key swing highs before stalling, alerting swing traders early.
Yard Charts offers a Free tier ($0) providing daily chart scanning across all supported asset classes. For active traders, the Standard plan ($20/month) and Premium plan ($30/month) provide automated 60-minute intraday alerts, multi-timeframe pattern detection, and a 7-day free trial: Explore Yard Charts Pricing & Free Trial.
Risk Management: Invalidation Levels and Defensive Execution
Mastering the bull trap pattern allows traders to execute structured short setups following pattern invalidation while protecting capital from adverse breakout momentum:
- Demand Closing Price Confirmation: Never enter a breakout or reversal based on an intra-candle price spike. Wait for the candlestick to officially close to ensure auction price acceptance.
- Establish Non-Negotiable Invalidation Levels: For Top Reversal short positions, place the protective buy stop strictly above the range upper line or trap high. When trading breakout continuations, place defensive stop loss orders directly beneath the breakout candle's low.
- Maintain Asymmetric Risk-to-Reward: Ensure every trade offers a favorable risk profile, targeting at least 2R to 3R returns relative to the initial dollar risk defined by the invalidation level.
Combining structural pattern recognition with objective invalidation parameters helps traders maintain objective risk limits and avoid chasing speculative liquidity sweeps across all market environments. For related frameworks, explore our in-depth guides on bearish flag top reversals and trading breakout mechanics.
Frequently Asked Questions
What is a bull trap pattern in trading?
A bull trap pattern is a deceptive price formation where an asset temporarily breaks above resistance to lure buyers, before reversing into a sharp decline that traps long positions at unfavorable valuations.
How does a liquidity sweep cause a bull trap?
Market participants push prices past key resistance to trigger resting buy-stop orders. This sudden influx of buying liquidity provides the counter-volume necessary for institutional sellers to exit large long holdings or build short positions without causing adverse slippage.
What is the difference between a bull trap and a bear trap?
A bull trap occurs at resistance levels and traps long buyers before collapsing downward. A bear trap occurs at support levels and traps short sellers before squeezing aggressively upward.
How does the Yard Charts Top Reversal rule trade a bull trap?
The Yard Charts Top Reversal requires four stages: an established uptrend, a horizontal range with at least 2 valid bounces, an upper-line false breakout spike, and a confirmed candle close below the lower range line. The short trade is executed only upon the close below the lower boundary, with a stop-loss placed strictly above the range high.
What is the velocity rule for a Top Reversal?
The velocity rule requires that the time price takes to ascend to the new swing high during the trap must be less than or equal to the time it took to decline (Ascent Time <= Descent Time), confirming that the spike was an unsustainable speculative impulse.
Does Yard Charts offer a free plan for detecting chart patterns?
Yes. Yard Charts provides a Free tier ($0) with daily pattern scanning across 13,000+ stocks, ETFs, forex pairs, and crypto assets. Paid plans include Standard ($20/month) and Premium ($30/month) featuring 60-minute intraday scans and real-time alerts with a 7-day free trial.
Disclaimer: Yard Charts is an educational charting and technical analysis software platform. All content, pattern detections, and alerts are provided strictly for educational and self-directed analytical purposes, and do not constitute financial, investment, or trading advice. Trading financial markets carries substantial risk of loss.
Disclaimer: Yard Charts provides technical-analysis tools and alerts. It is not investment advice. Trading involves risk of loss.