Price changes because the bid and the offer change. Someone is willing to pay more, or someone is willing to sell for less. That is the whole mechanism.
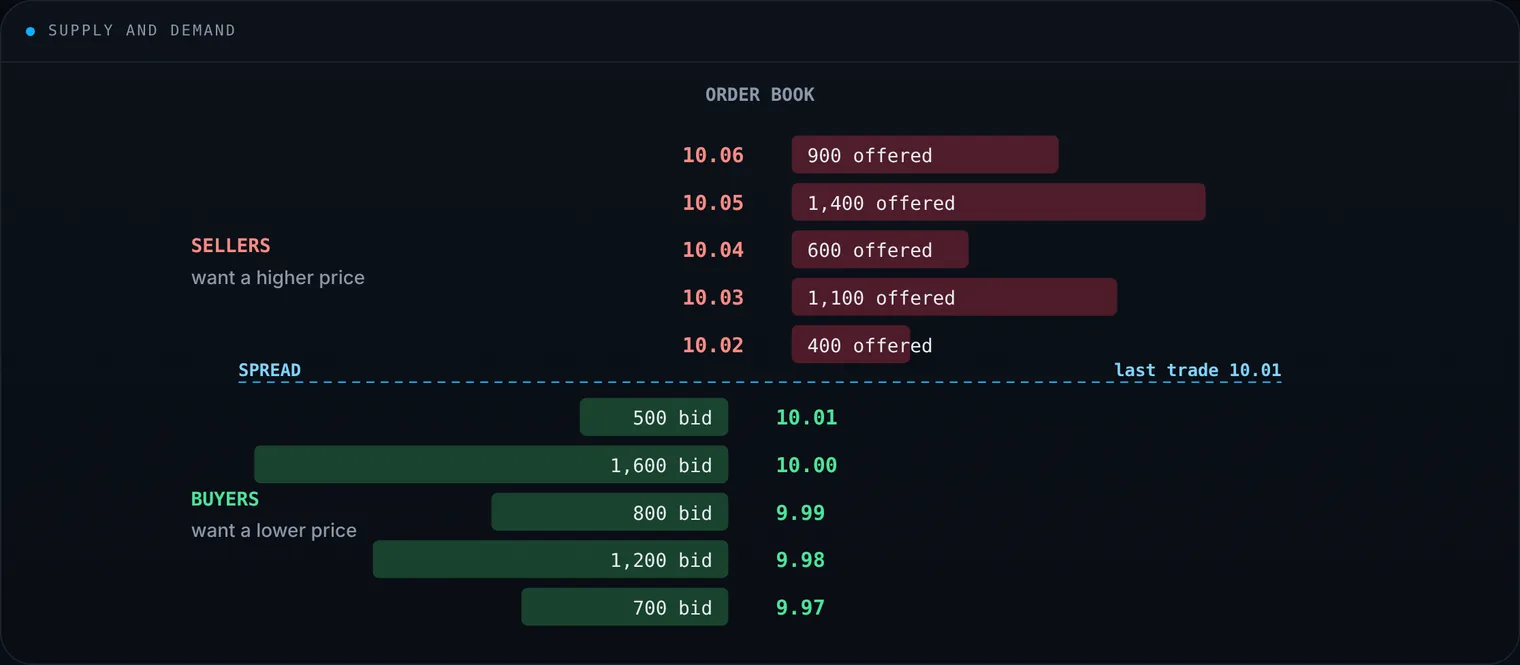
Every trade is a match at one price. More buyers than sellers lifts the price until a seller appears; more sellers than buyers pushes it down until a buyer appears.
Supply and demand
More buyers than sellers: price rises until a seller appears. More sellers than buyers: price falls until a buyer appears. Every print is a match at one price.
Expectations beat the headline
Good news does not automatically lift a stock. The market prices what was already assumed. Record earnings can sell off if the number is light against the estimate; a loss can rally if it is less bad than feared. The tape looks forward; it does not grade yesterday.
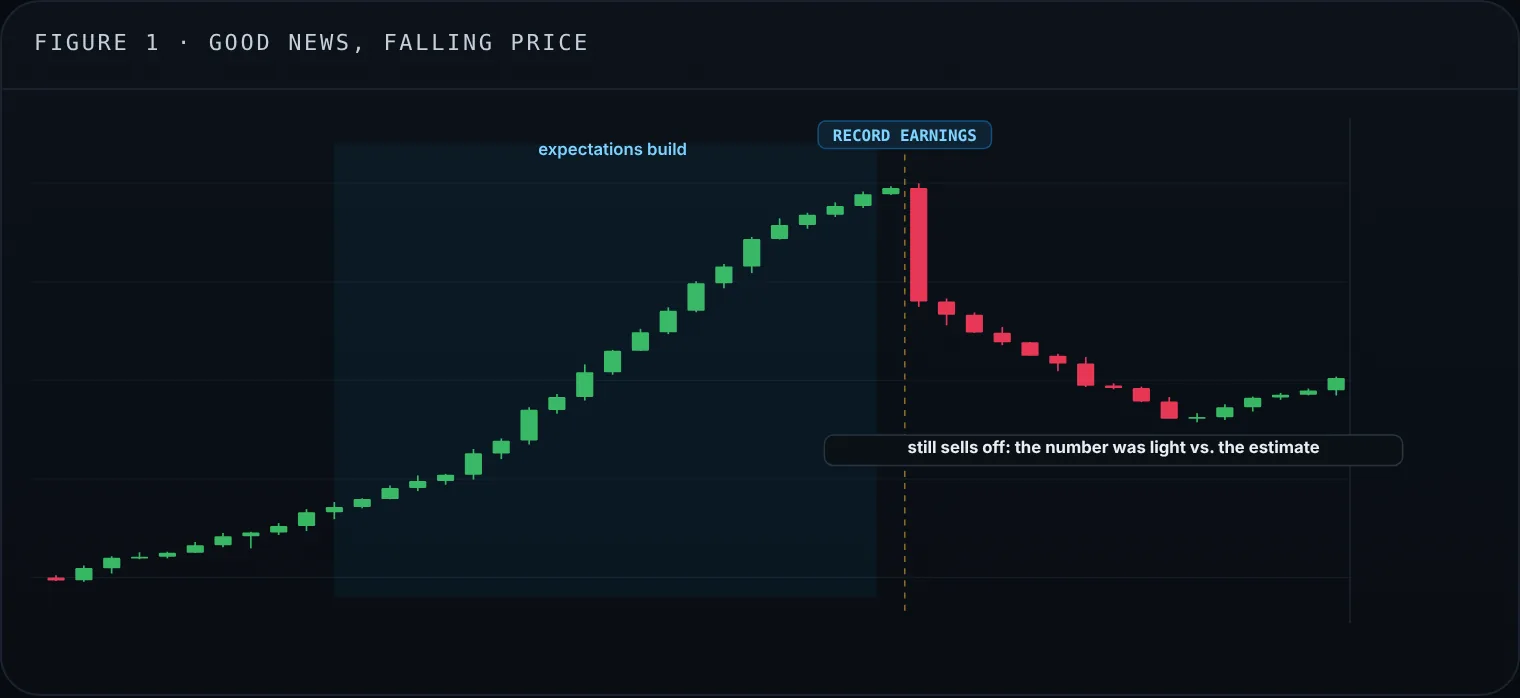
An illustration of “priced in”: the rise came before the news, so a good number that falls short of expectations still sells off.
The backdrop
Companies sit inside interest rates, inflation, jobs, spending, central banks, politics and geopolitics. Those inputs shift the profit path of many companies at once, which is why an index can move on a day when no single firm reported anything.
Psychology
Orders come from people. Fear of missing out (FOMO) adds bids; fear dumps offers through levels that still look fine on a spreadsheet. Sentiment can stretch price away from the last known fundamentals, and it can snap it back.
Where the chart fits
Charts do not forecast with certainty. They show where buyers and sellers have already fought: trends, support and resistance, flags, triangles, head and shoulders, breakouts. The same order-flow problem keeps leaving the same shapes. Use that with position size, a stop and whatever fundamental work the trade needs.
Yard Charts flags those structures and the levels around them. It does not promise the next tick.
Key takeaways
- Short-term noise is normal.
- Every move still has a cause: a change in who is willing to trade, and at what price.
Alerts and examples are for education only and are not investment advice. Past patterns do not guarantee future results.
Disclaimer: Yard Charts provides technical-analysis tools and alerts. It is not investment advice. Trading involves risk of loss.