Trading Without Tension: How Modern Investment Tools Rewired My Strategy
Struggling with emotional trading? This is how pattern-based tools turned my chaos into clarity, with stop-loss discipline and strategic entries.
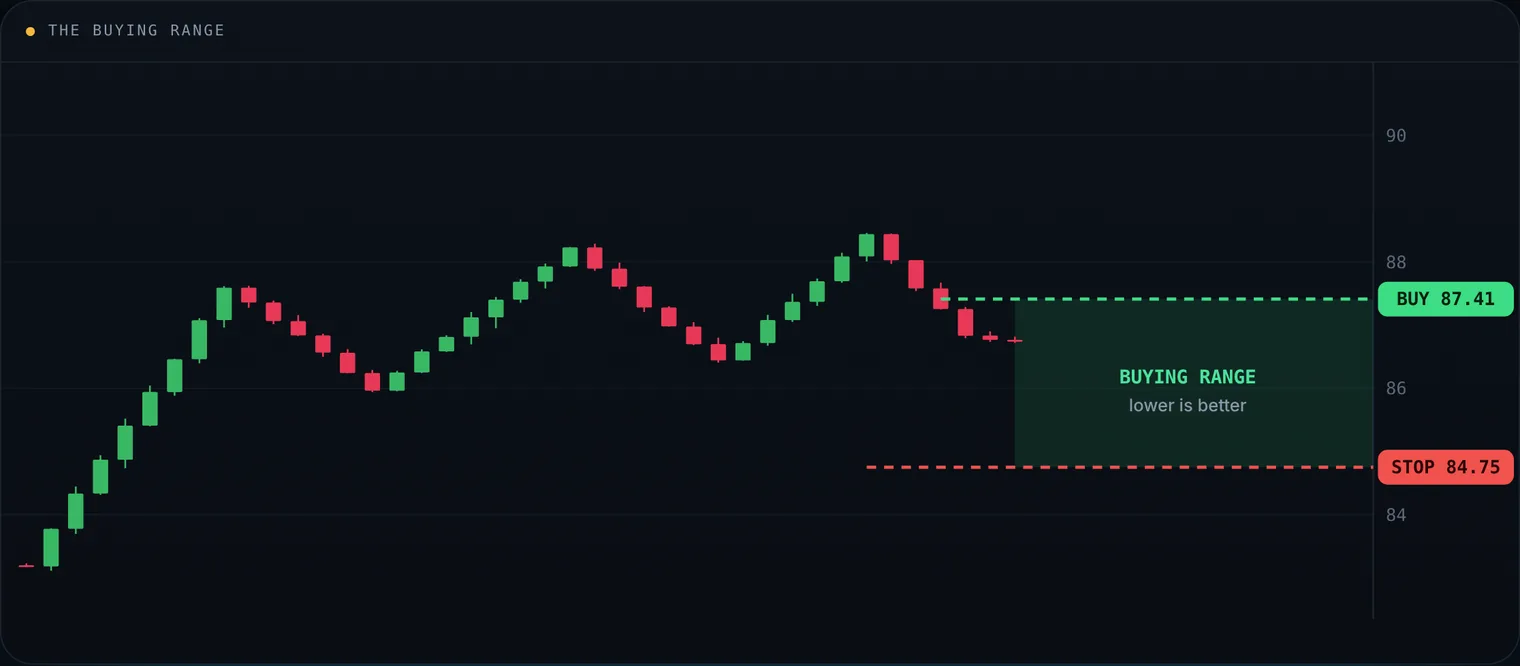
A bullish alert gives a buying range: the buy at $87.41 and the stop at $84.75. The lower you buy inside it, the better the trade.
The emotional roller coaster
I still remember my early trading days: eyes glued to the screens, second-guessing every move, living in the “what ifs”. The pit in my stomach when a position turned against me. The sleepless nights wondering whether to cut my losses or keep holding. Sound familiar?
When I adopted structured tools, the chaos became clear. That is when I found Yard Charts, a tool that sits between intuition and discipline. After years of market volatility, I have come to believe that successful trading is not about predicting the future. It is about having a plan you can rely on to keep your discipline and take the emotion out of trading.
Why disciplined tools are not optional
The brutal truth is that raw charts and gut feeling leave huge blind spots. Where do I enter? When do I admit I am wrong? How much am I willing to lose before I give up?
Without firm answers to those questions, we are gambling with a fancy interface. I have watched many traders, myself included, make the same mistakes again and again: we get in on hope, hold losers too long and sell winners too soon. Why? Because when money is at stake, we cannot see clearly.
Pattern-based tools fix this by giving you a structure that makes objectivity possible. They do not remove risk (nothing can), but they change how you face it. They turn market noise into clear signals: when to enter, when to exit and how much risk to take, before a cent is on the line.
Reading the market’s language
Spotting a pattern is like recognising a friend in a crowd: once you know what to look for, it is obvious. Bullish and bearish flags are not magic. They are the visible trace of buyer and seller behaviour as it happens.
A bullish flag usually appears after a strong run up and a brief sideways or lower consolidation, as if the market were catching its breath before the next leg. A bearish flag follows a sharp fall, then a small bounce or sideways drift before the decline continues.
Flags are not crystal balls; they are probabilities. Yard Charts measures what the market is whispering and turns subjective pattern-spotting into objective data. Instead of squinting at a chart asking “is that a flag?”, the platform takes the guesswork out. See the eight patterns.
The stop loss: your safety net
One change transformed my trading: I stopped treating stop losses as suggestions and started treating them as non-negotiable exits.
My old thinking was pure hope. “Maybe it will bounce tomorrow.” “The company’s financials are strong.” “I’ll just wait until it comes back.” That approach cost me more sleepless nights, and more money, than I care to remember.
Now, when a Yard Charts alert shows Stop loss: $84.75, it is not a suggestion; it is my exit GPS. It comes from the structure of the pattern and marks the point where the original idea no longer holds. If I am bullish on a stock at $87 with the stop at $84.75, that is my line in the sand. No debate, no second-guessing: if price gets there, I am out.
Strategic entries: buying in the zone
Another big change came from learning where to enter instead of chasing breakouts at any price. Yard Charts alerts define a range, such as $84.75 to $87.41, and that matters more than you might think.
I used to buy into every breakout, usually at the worst point of the move. Now I look for pullbacks into the zone. If I buy 100 shares at $84.75 instead of $87.41, I save $266. That is not just money in my pocket: with a lower entry, the same capital buys more shares, so the upside grows while the stop level stays the same.
- Buy at the top: $87.41 (100 shares = $8,741)
- Buy at the bottom: $84.75 (100 shares = $8,475)
- Saved: $266 (same stop, better trade)
The psychological lift matters too. Enter near the bottom of the zone and the position moves into profit sooner, which reinforces your confidence in the analysis.
Making money when stocks fall
Many traders only know how to make money when markets rise. Pattern tools work for the bears too.
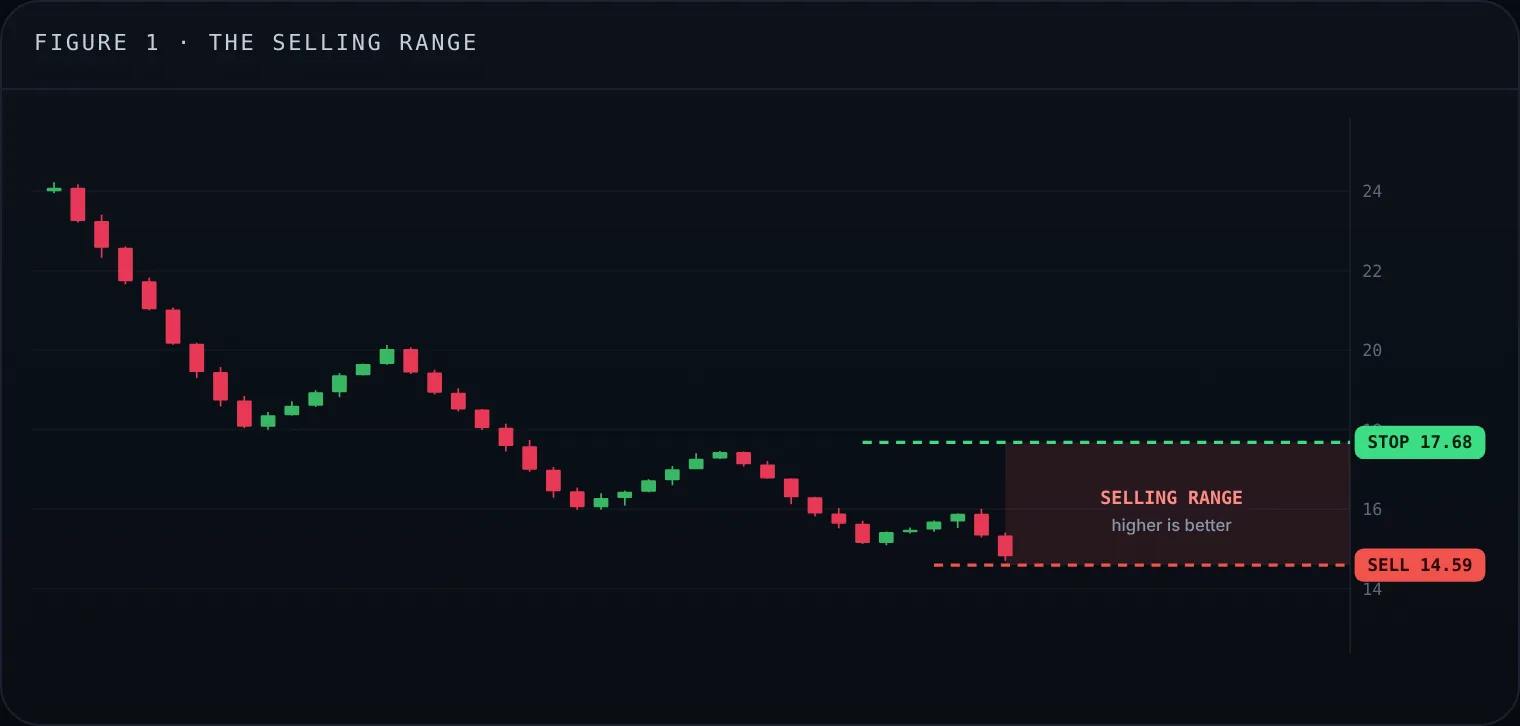
A bearish alert defines a selling range: sell at $14.59, with the buy stop at $17.68. The higher you sell inside it, the better.
Say a bearish flag is forming and Yard Charts suggests shorting between $14.59 and $17.68. The logic is reversed: you want weakness in that zone, with a buy stop at $17.68.
I will never forget when this paid off during a surprise rally. The stock I was short spiked above my buy stop at $17.68. My old self would have held on, waiting for the rally to fade. The tool did not make me money that day, but it got me out, turning a potentially devastating loss into a small one. The stock kept rising for another week.
Tools can protect us from our worst enemy: ourselves. We want to be right, even when the market says we are not. When you accept in advance where you are wrong, the ego leaves the equation.
More than the numbers
Structured tools are worth their weight in gold, and not only for profit and loss. They give peace of mind. With my exit already decided, my mind is free for other opportunities, and for life.
Before this systematic mindset, I would lie awake mulling over positions, checking after-hours prices and dreading the next open. Now I sleep better because I know exactly what I will do in any scenario. Stops, targets and risk are set before I place the trade.
Discipline is not limiting; it is liberating. The more you trust and practise a set of rules, the less time you spend doubting and the more you spend executing. You become proactive instead of reactive, strategic instead of emotional. And because you understand the logic behind each signal, you are an active player, not a passive follower.
Tools as trading partners
Yard Charts is not a robot deciding for me. It is the level-headed friend I needed years ago: a bridge between analysis and accountable action. Structure gives you freedom, not rigidity. With clear entries, exits and risk management, you focus on execution instead of wondering whether you are right.
A systematic approach does not guarantee profits; no honest tool can claim that. What it offers is predictability, transparency and emotional balance. Together, those three have changed not only my trading but my whole experience of the market.
Key takeaways
- Treat the stop as an exit, not a suggestion.
- Buy low in the range (or sell high in it) instead of chasing.
- Bearish setups work too, with a buy stop above.
- Decide everything before the trade, then execute.
Ready to sharpen your edge? The difference between hoping and knowing could be just what your portfolio needs. Start for free.
Alerts and examples are for education only and are not investment advice. Past patterns do not guarantee future results.
Disclaimer: Yard Charts provides technical-analysis tools and alerts. It is not investment advice. Trading involves risk of loss.