Support and resistance are price zones where the market has repeatedly stalled, reversed or paused. They mark where buying or selling has been strong enough to matter.
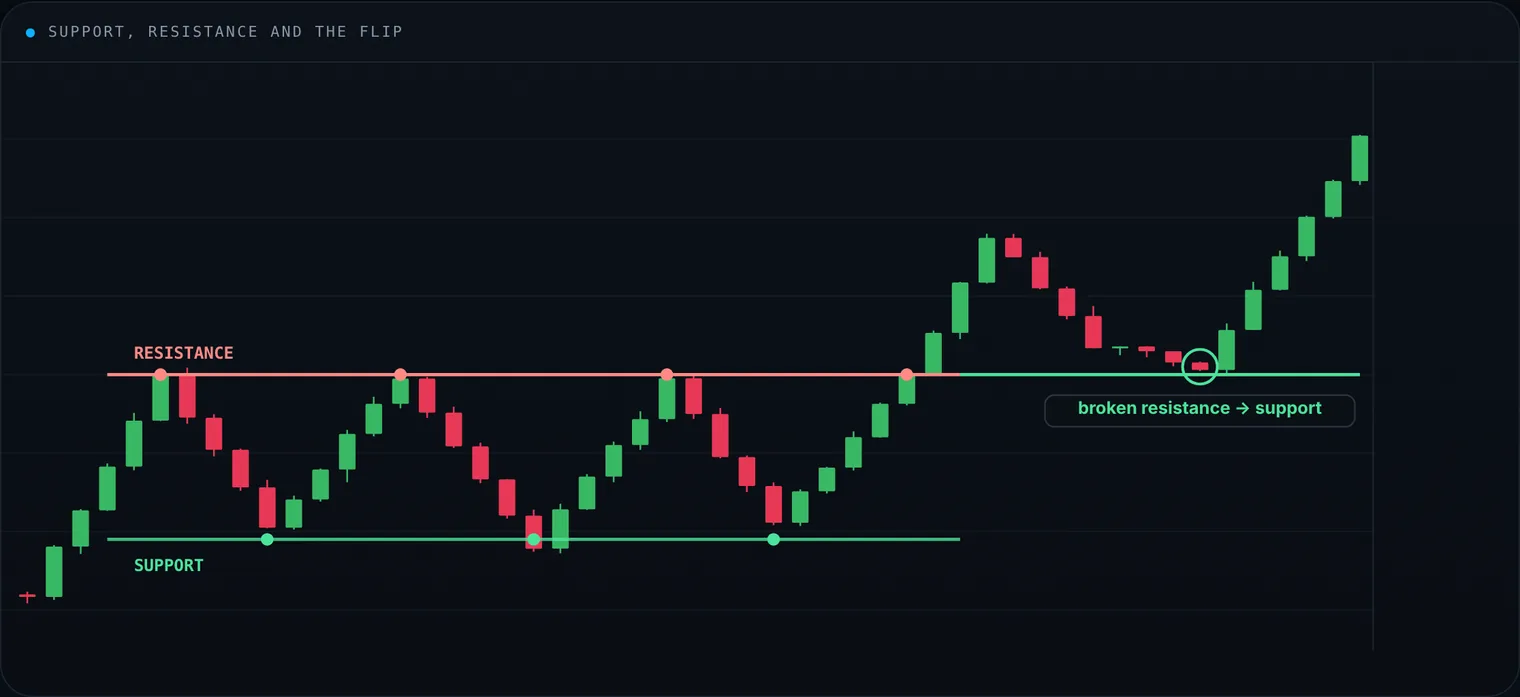
Price bounces between support and resistance until it closes above resistance. The old ceiling then acts as the new floor.
Support
- A level where buying has repeatedly absorbed selling and stopped a decline
- If price bounces from $100 more than once, traders treat $100 as support
Resistance
- A level where selling has repeatedly capped advances
- If price fails at $100 more than once, $100 is resistance
Why they matter
Traders remember prior reactions and cluster orders around the same zones. That concentration is what makes a level useful for entries, exits, stops and targets.
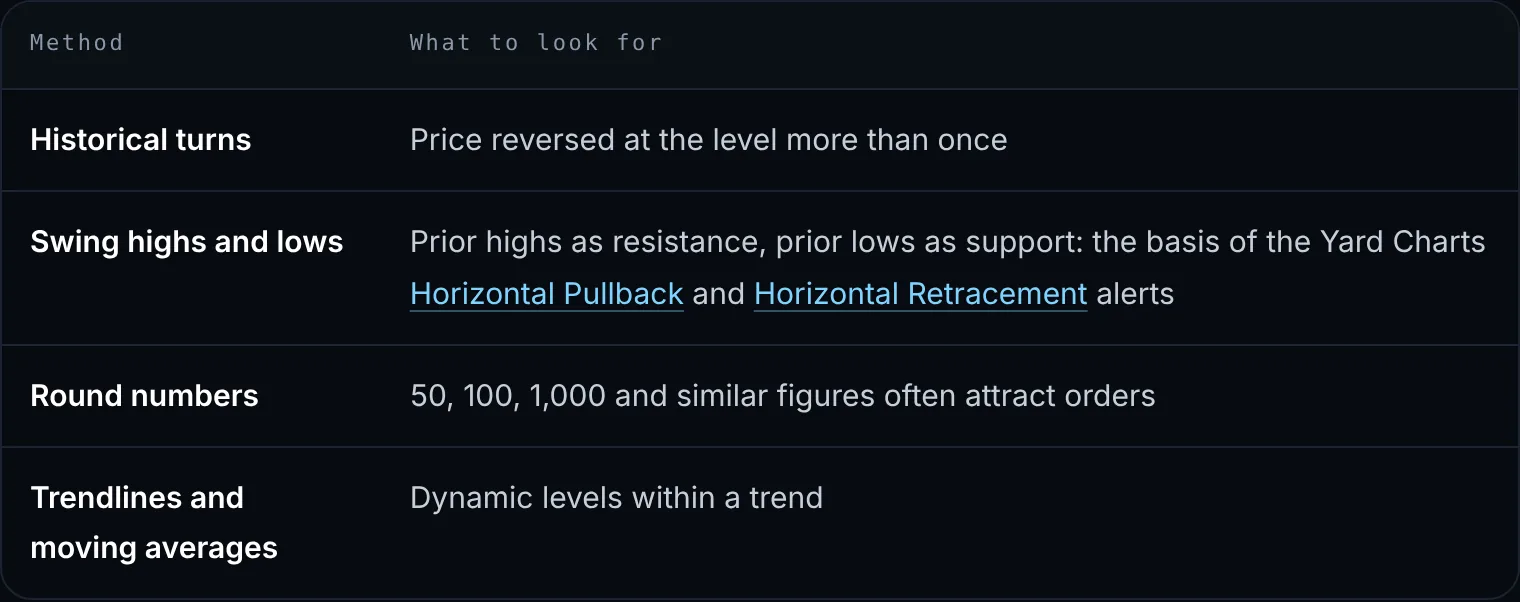
How to find them
When they break
Levels are not permanent. Broken resistance often becomes support, and broken support often becomes resistance: sentiment has shifted.
Wait for the close. Not every poke beyond a level is a real break. Wait for a close through it, preferably on volume, before treating the old level as flipped.
Key takeaways
- Use levels as a map of where decisions have clustered.
- Combine them with pattern recognition and a defined stop.
- They do not predict the next tick.
Alerts and examples are for education only and are not investment advice. Past patterns do not guarantee future results.
Disclaimer: Yard Charts provides technical-analysis tools and alerts. It is not investment advice. Trading involves risk of loss.