These markets all move on a chart, but they are different instruments. Liquidity, trading hours, what you actually own and what can go wrong all differ. Assess the instrument first, then read the chart.
- Stocks: A claim on a company.
- Crypto: A unit on a blockchain.
- Forex: One currency against another.
- Commodities: Raw materials: metals, energy, crops.
- ETFs: Many holdings in one listed product.
- Indices: A measure of a basket.
Stocks
A stock is a claim on a company. If the business grows, the share price tends to rise with it over time, and some companies also pay dividends. Apple, Microsoft, Amazon and Tesla are familiar examples. Investors weigh earnings, management and growth; traders trade the swings.
Prices move with earnings, interest rates, the economy and sentiment. Over a long enough period single names can grow spectacularly (Apple) or fail outright (Lehman Brothers). Size and diversify for that.
Crypto
A crypto token is a unit on a blockchain: a shared ledger that records transfers without a single firm in the middle. Bitcoin is the original; everything else is an altcoin. Some chains run smart contracts, code that executes when conditions are met. That layer is the base for decentralised finance: lending, swaps and settlement that run on-chain instead of through a bank.
Two traits matter in practice. Transactions are secured by cryptography and network consensus, not by a clerk. And the protocols are largely open source, which is why they serve as building blocks for Web3 applications.
Charts still apply: trend, level, pattern. Volatility is usually higher than in large-cap stocks, and liquidity, venue and protocol risk sit on top of price risk. Bitcoin and a thin altcoin are not the same market.
Forex
Forex is trading one currency against another. It is the largest market by turnover: more than $7 trillion a day on the latest BIS survey. Common pairs are EUR/USD, GBP/USD, USD/JPY and AUD/USD. The drivers are interest rates, inflation, central banks, economic data and politics, and the market runs 24 hours through the business week.
Liquidity is deep and spreads can be tight. Leverage is the main risk: it magnifies losses as fast as gains. Many pairs respect well-watched technical levels, which does not remove the need for a stop.
Commodities
Gold, silver, crude oil, natural gas, wheat, coffee. Price is mostly supply and demand: wars lift oil, weather moves crops, and gold is often bid when uncertainty rises. Commodities can diversify a portfolio or hedge inflation; they can also gap on inventory data and geopolitics.
ETFs
An ETF packages many holdings into one listed product. One ticker can track the S&P 500, a sector, a theme or a region. The point is built-in diversification and lower fees than many active funds. You still carry market risk, and an ETF can trade at a premium or discount to its basket.
Indices
An index measures a basket, not one company: the S&P 500, Nasdaq-100, Dow, FTSE 100, DAX 40 or Nikkei 225. You cannot buy the index itself; exposure comes through ETFs, funds, futures or CFDs. Company-specific risk is lower than in a single stock, but factor and macro risk remain.
At a glance
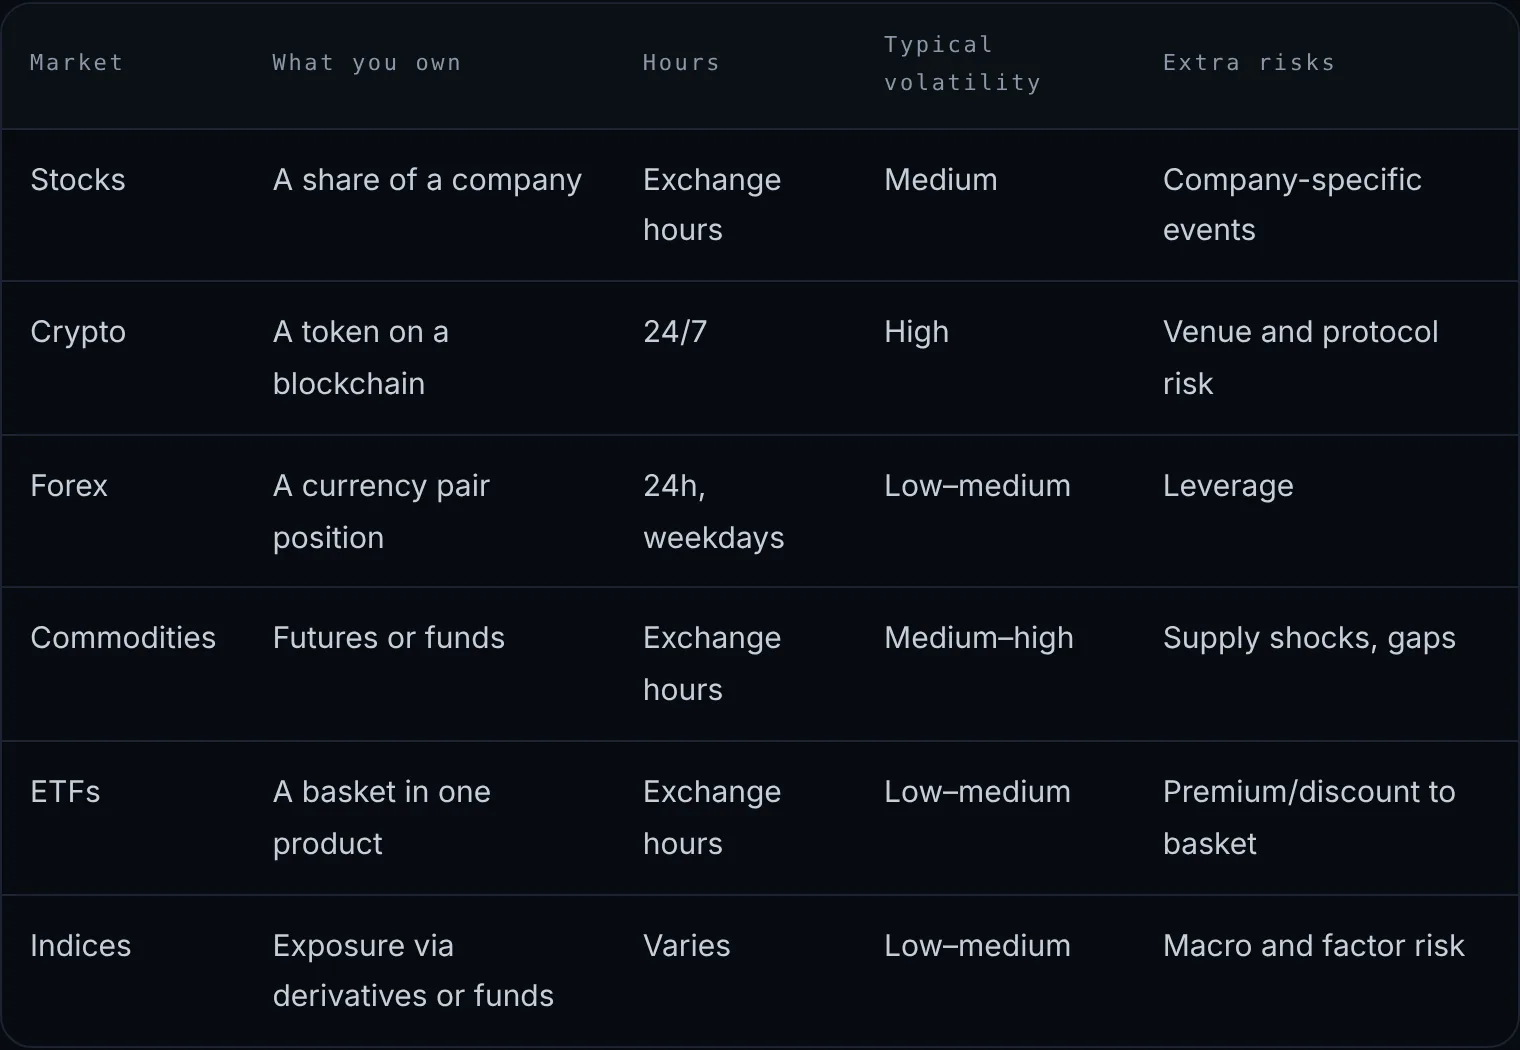
Choosing a market
There is no single best market. Match hours, volatility and instrument risk to your account and your plan. Long-horizon capital often sits in stocks or broad ETFs. Active traders often use forex or indices for hedging and liquidity. Commodities fit inflation and supply shocks. Crypto adds blockchain and protocol risk on top of price.
What Yard Charts scans. Yard Charts reads the same structures (trend, support and resistance, pattern) across these markets: ETFs, Forex, Crypto and India’s BSE on the Free plan; Nasdaq, NYSE, LSE and Xetra with Standard. The scan does not pick the market for you; it flags the setup once you have chosen where you can take the risk. Compare plans.
Alerts and examples are for education only and are not investment advice. Past patterns do not guarantee future results.
Disclaimer: Yard Charts provides technical-analysis tools and alerts. It is not investment advice. Trading involves risk of loss.