A pullback is a temporary move against the prevailing trend. The trend stays intact: price pauses, then continues in the same direction.
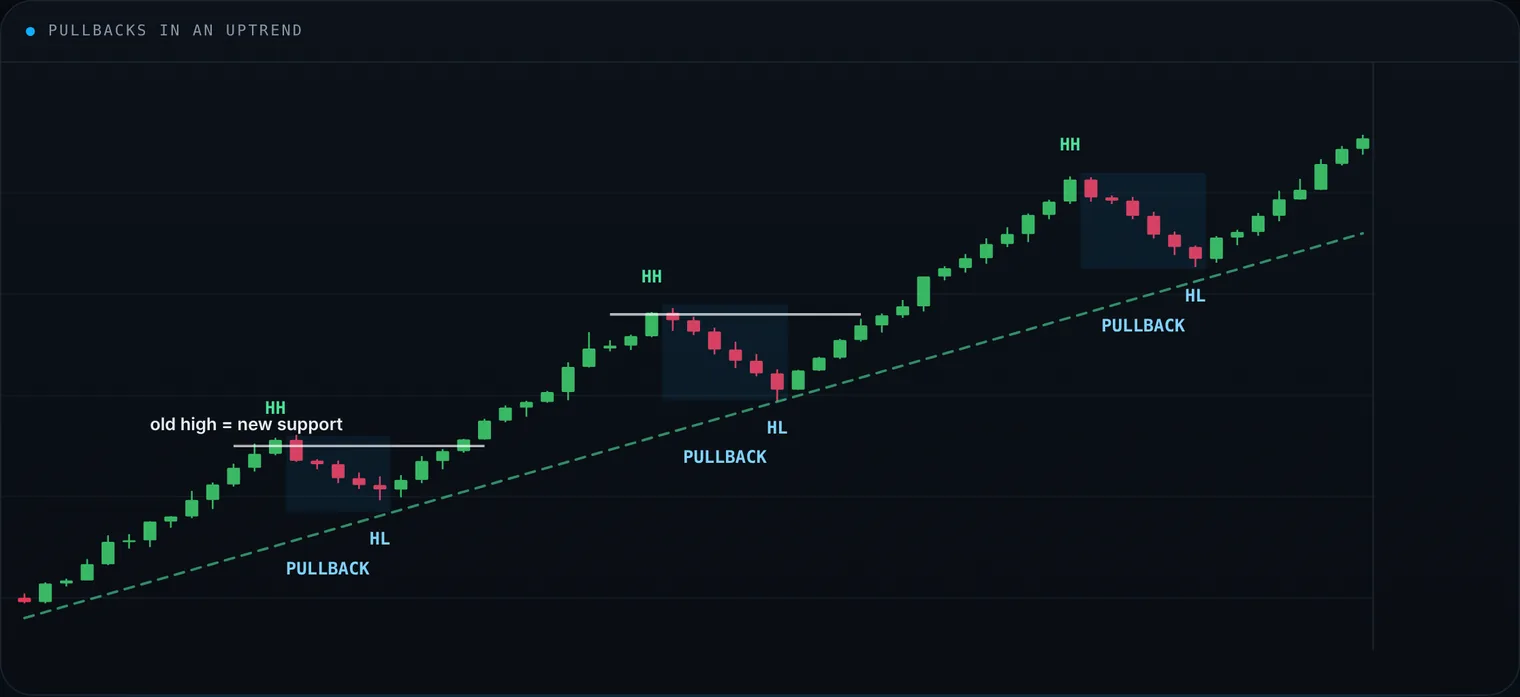
An uptrend rarely moves in a straight line. Each pullback holds a higher low, and old highs often act as support.
Markets almost never travel in a straight line. In an uptrend, some traders take profit and others wait for a better price. Selling increases for a stretch, price dips, new buyers step in and the rise resumes. In a downtrend the same happens in reverse: a brief bounce, then sellers take control again.
That dip, or bounce, is the pullback. On its own it is not a reversal.
Why pullbacks happen
- Profit-taking after a run
- New money waiting for a better entry
- Price reaching support, resistance, a moving average, a trendline or a Fibonacci level
- Short-term news or sentiment that does not change the larger trend
Pullback or reversal?
At the start they look the same. The difference shows up in the structure. A pullback leaves the trend in place: higher highs and higher lows in an uptrend, lower highs and lower lows in a downtrend. A reversal breaks that structure and starts a new trend.
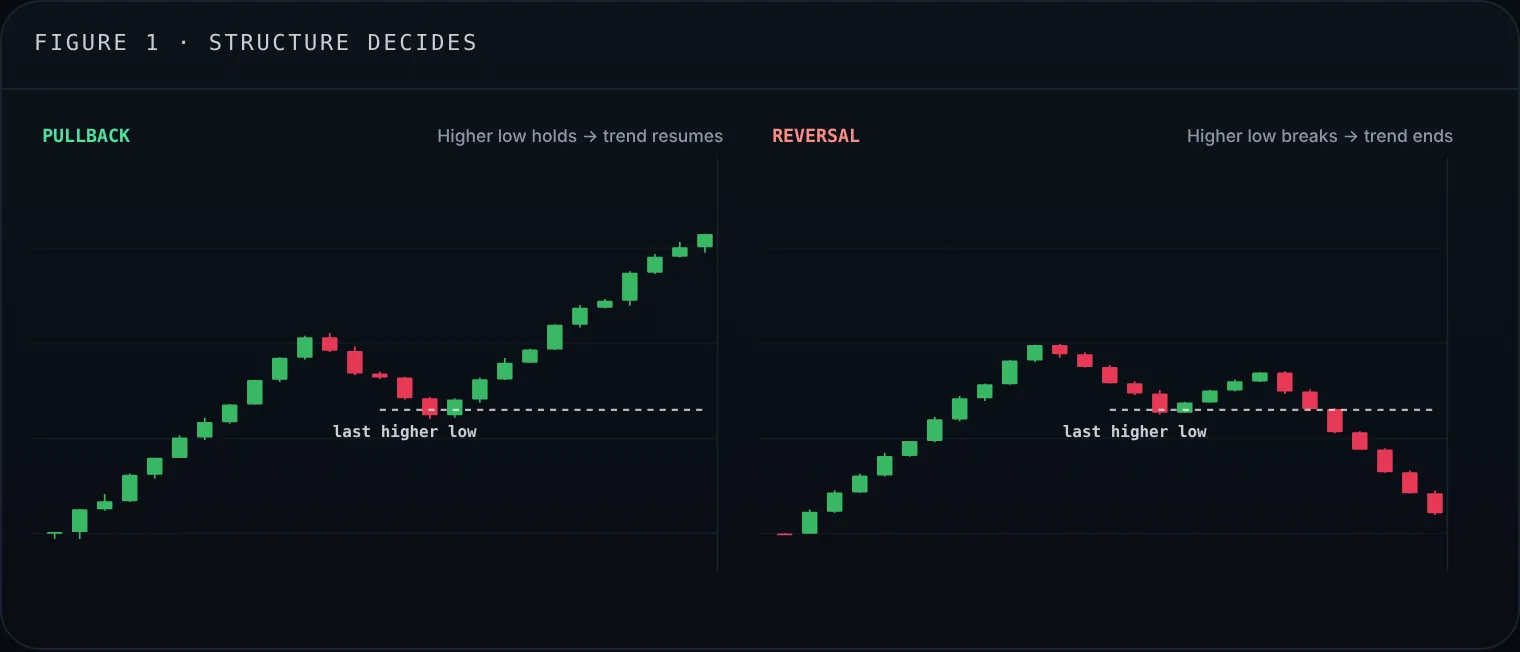
The same first dip can end two ways. If the last higher low holds, it was a pullback; if it breaks, the trend is turning.
No single candle or indicator settles it in real time. Check the larger trend, whether key levels hold, whether volume supports the move, and whether momentum is fading. One session is not enough.
How traders identify them
Look for evidence, not every small dip:
- The structure is still intact
- Price is retracing towards the 20, 50 or 200-period moving average
- Price is testing a prior breakout level: old resistance acting as support, or the reverse
Yard Charts flags these tests. The Horizontal Pullback and Horizontal Retracement alerts fire as price returns to the level that launched the last leg.
Fibonacci retracement
After a clear swing, traders mark the 38.2%, 50% and 61.8% retracement levels to estimate where a correction may stall. These levels do not predict price. They matter more when they line up with support, resistance, a moving average or a trendline.
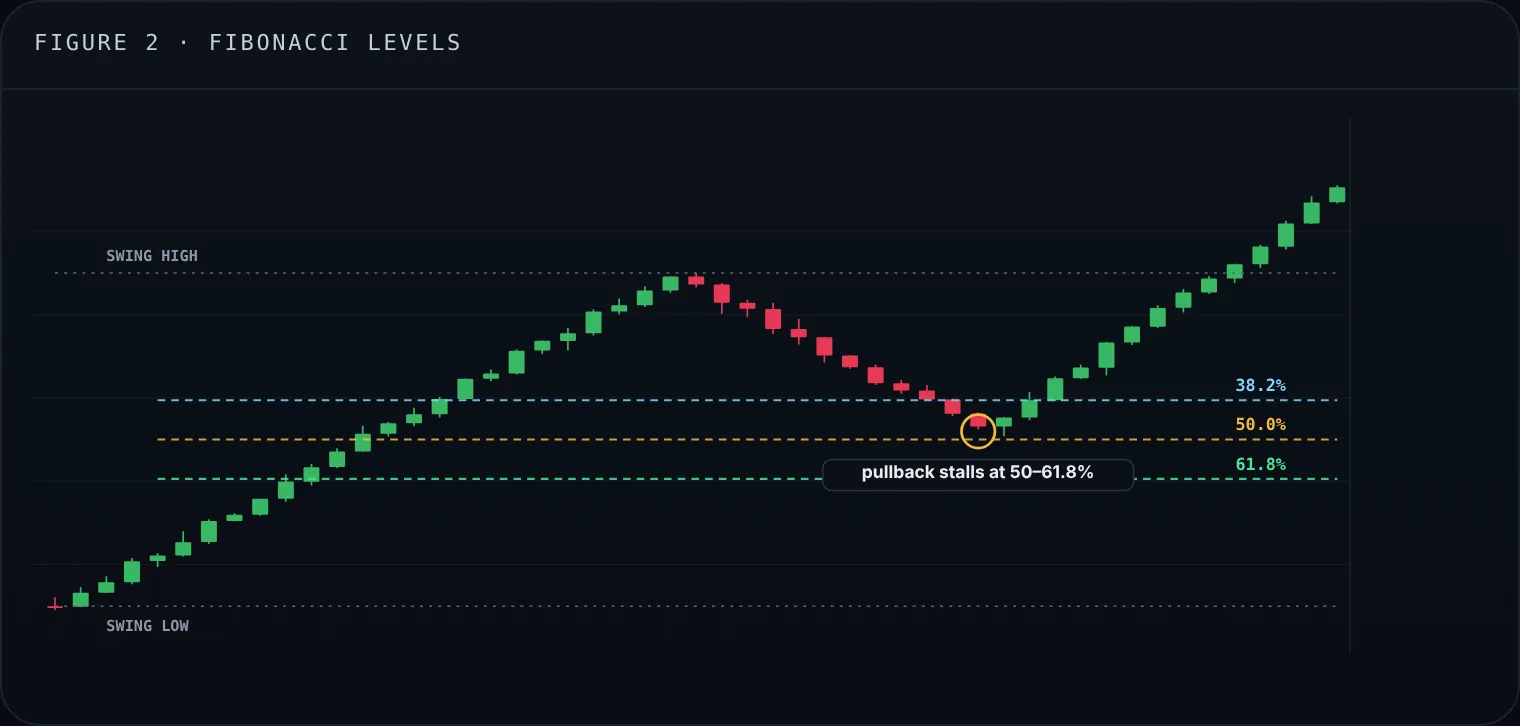
Retracement levels measured on the swing from low to high. Here the pullback stalls between 50% and 61.8%, then the trend resumes.
Trading the pullback
Trade with the existing trend. Do not chase the impulse.
- Confirm a clear trend. Higher highs and higher lows, or the reverse.
- Wait for the retrace. Let price come back towards a level.
- Wait for a sign it is ending. A higher low, a rejection candle, momentum turning back.
- Enter with the original trend. Not against it.
- Place a stop. Below the pullback low in an uptrend, above the high in a downtrend.
Entering as soon as price ticks against the trend is the usual error. The pullback is not finished just because it started.
Risk
Trends can correct further than expected. Use a stop, cap the amount risked per trade and wait for confirmation. No setup works every time.
Common mistakes
- Buying the high after missing the first move
- Exiting a good trend on a normal retrace
- Treating every dip as a reversal
- Trading the first counter-move with no confirmation
Key takeaways
- Pullbacks are normal in a working trend.
- The structure, not one candle, tells a pause from a break.
- Enter with the trend, with defined risk.
Alerts and examples are for education only and are not investment advice. Past patterns do not guarantee future results.
Disclaimer: Yard Charts provides technical-analysis tools and alerts. It is not investment advice. Trading involves risk of loss.