A trend is the direction price travels over time. Trade with it, and do not treat every swing as a new story.
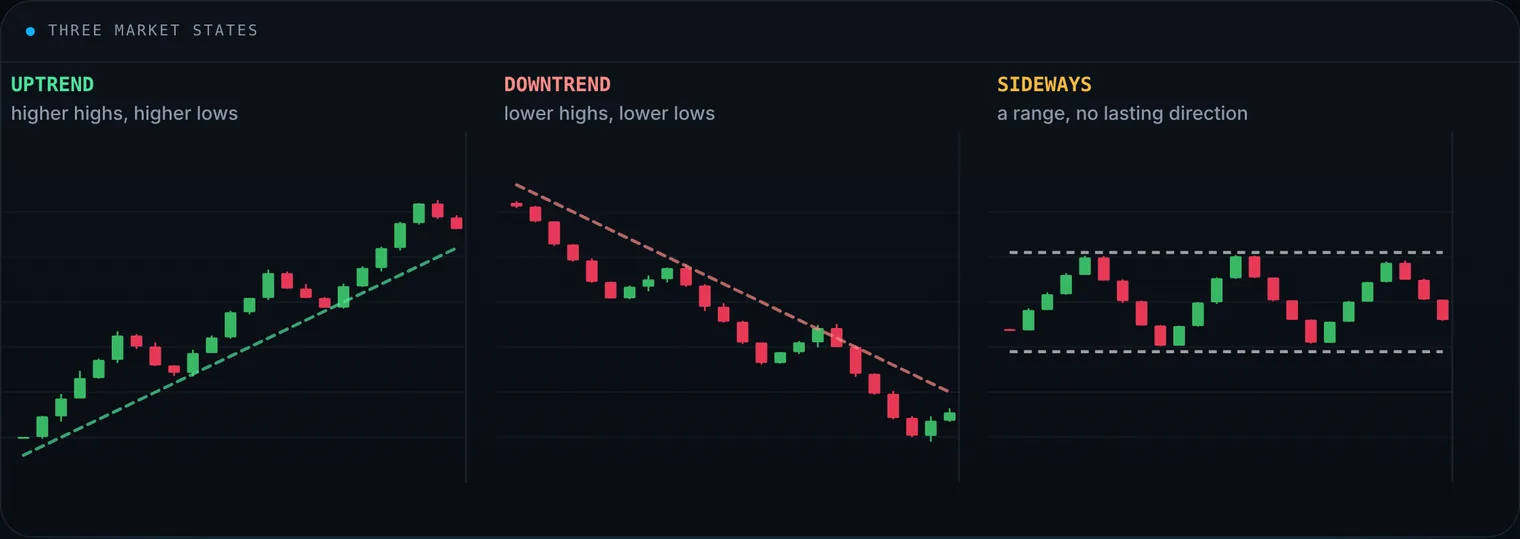
Name the state first, then decide.
Three states
- Uptrend: higher highs and higher lows. Buyers in control.
- Downtrend: lower highs and lower lows. Sellers in control.
- Sideways: a range with no lasting higher or lower structure.
How to read it
Do not lean on one tool. Track both the direction and the speed of the move. An uptrend becomes clearer as higher closes arrive in sequence, each with a substantial rise; a downtrend as lower closes arrive, each with a substantial decline. The faster those closes print and the larger the moves, the stronger the evidence.
Price action
Structure is the base layer. As long as higher highs and higher lows hold, the uptrend is intact, and the reverse for a downtrend. Price is the record of who won.
Moving averages
The 50-day and 200-day averages smooth the noise. Price holding above them favours a bullish bias; holding below them, a bearish one. A single cross is not a trend by itself.
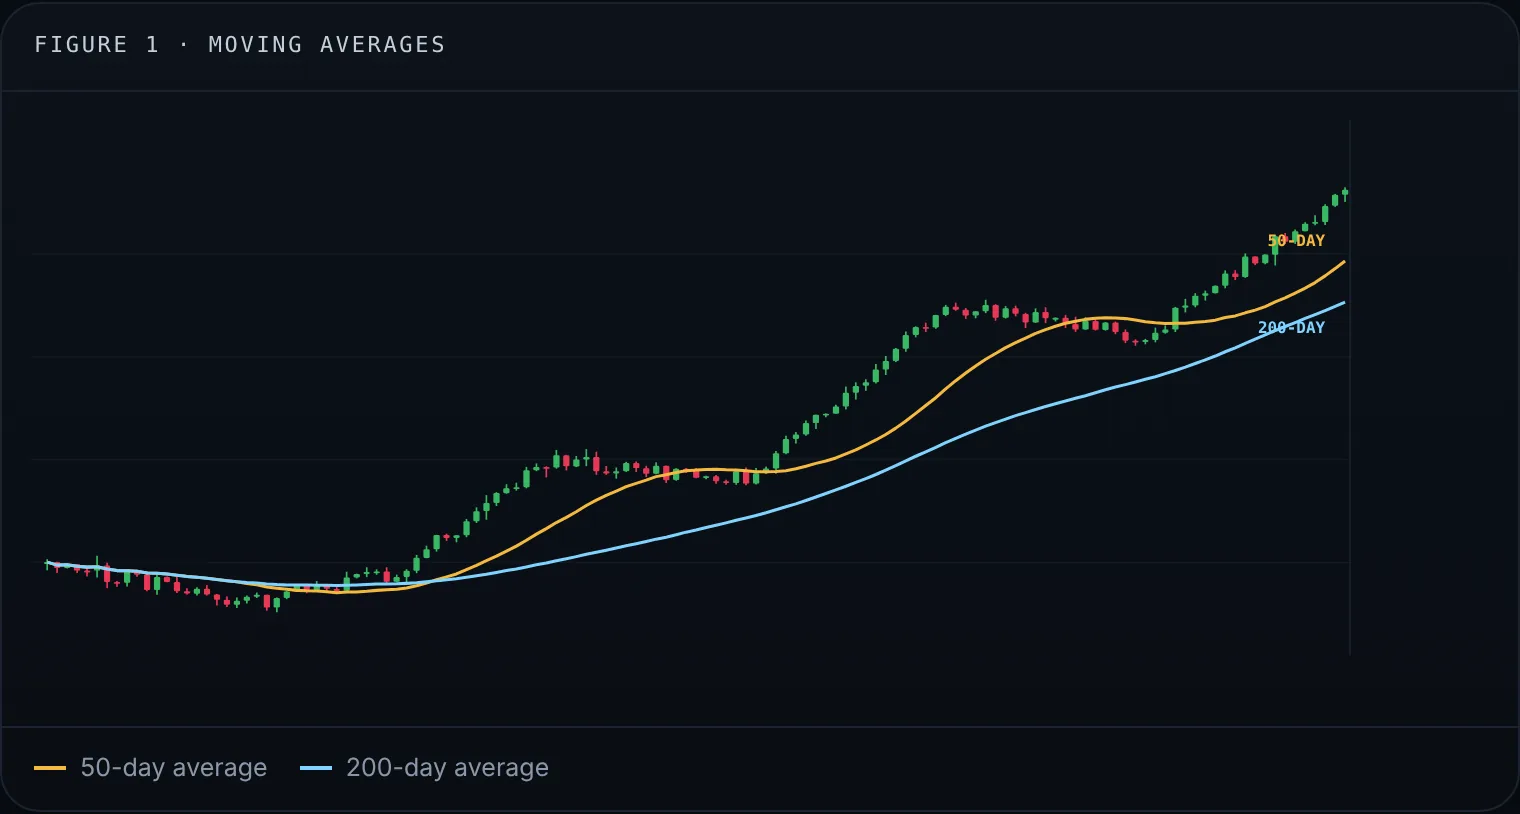
In a healthy uptrend price holds above both averages, and the faster one stays above the slower one.
Trend supports and resistances
In an uptrend, pullbacks often land on prior breakout levels or rising horizontal supports, the levels Yard Charts alerts on. In a downtrend, rallies often stall at prior breakdown levels. A close above range resistance can start an uptrend; a close below range support can start a downtrend. Yard Charts scans for those breaks as possible trend reversals.
Volume
A real trend usually travels with participation. A move on thin volume is easier to fade.
Common mistakes
- Calling a reversal on short-term noise
- Using one indicator alone
- Ignoring the higher timeframe
- Trading against the active structure
Key takeaways
- Confirm direction with structure first, then averages, levels and volume.
- No combination is perfect: it is a framework for bias, not a forecast.
Alerts and examples are for education only and are not investment advice. Past patterns do not guarantee future results.
Disclaimer: Yard Charts provides technical-analysis tools and alerts. It is not investment advice. Trading involves risk of loss.