Yard Charts suggests buy and sell points based on technical pattern recognition, and every signal comes with a stop-loss level to manage risk. The aim is to maximise potential gains while limiting the downside, so you can trade with more confidence and discipline.
Bullish patterns: “Buy at” and the stop loss
When a bullish pattern is identified, the strategy is to buy lower and sell higher. The alert gives a Buy at level, in this example $87.41. If you can buy even lower within the buying range, even better: a bullish pattern expects the price to rise, and a lower entry both reduces your risk and buys more shares with the same money.
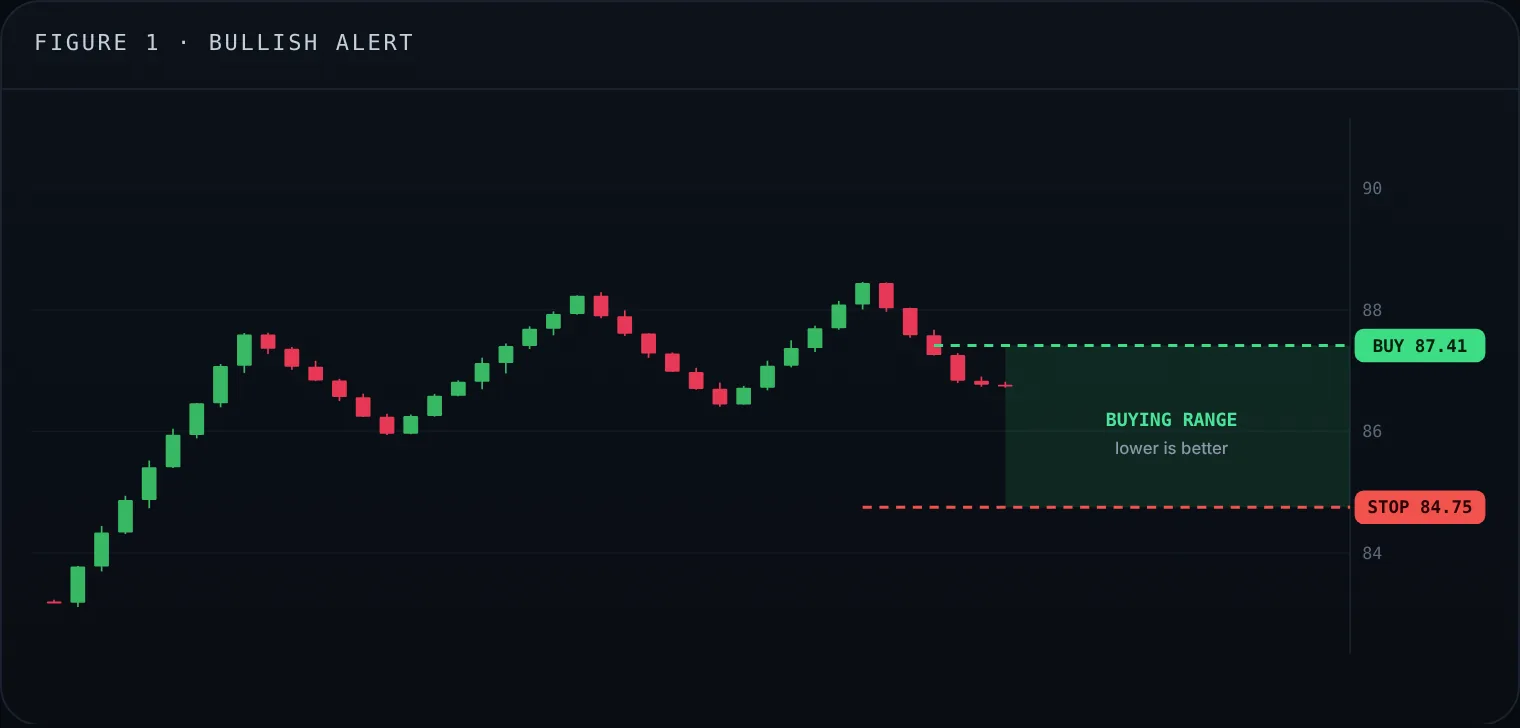
Bullish example: buy at $87.41, stop loss at $84.75.
Patterns are not 100% accurate, and sometimes the expected move fails. The stop loss confirms that the pattern is invalid: here $84.75. If price falls below it, the bullish pattern no longer holds and the loss should be cut.
So the buying range runs from $84.75 to $87.41. The lower you buy within it, the more you make if the pattern works, and the less you lose if it fails:

Buying as close as possible to the stop both increases the potential gain and shrinks the potential loss.
Bearish patterns: “Sell at” and the buy stop
When a bearish pattern is identified, the strategy is to sell higher and buy back lower, profiting from the expected decline. The alert gives a Sell at level, here $14.59. Selling even higher within the range increases the profit potential and reduces the risk.
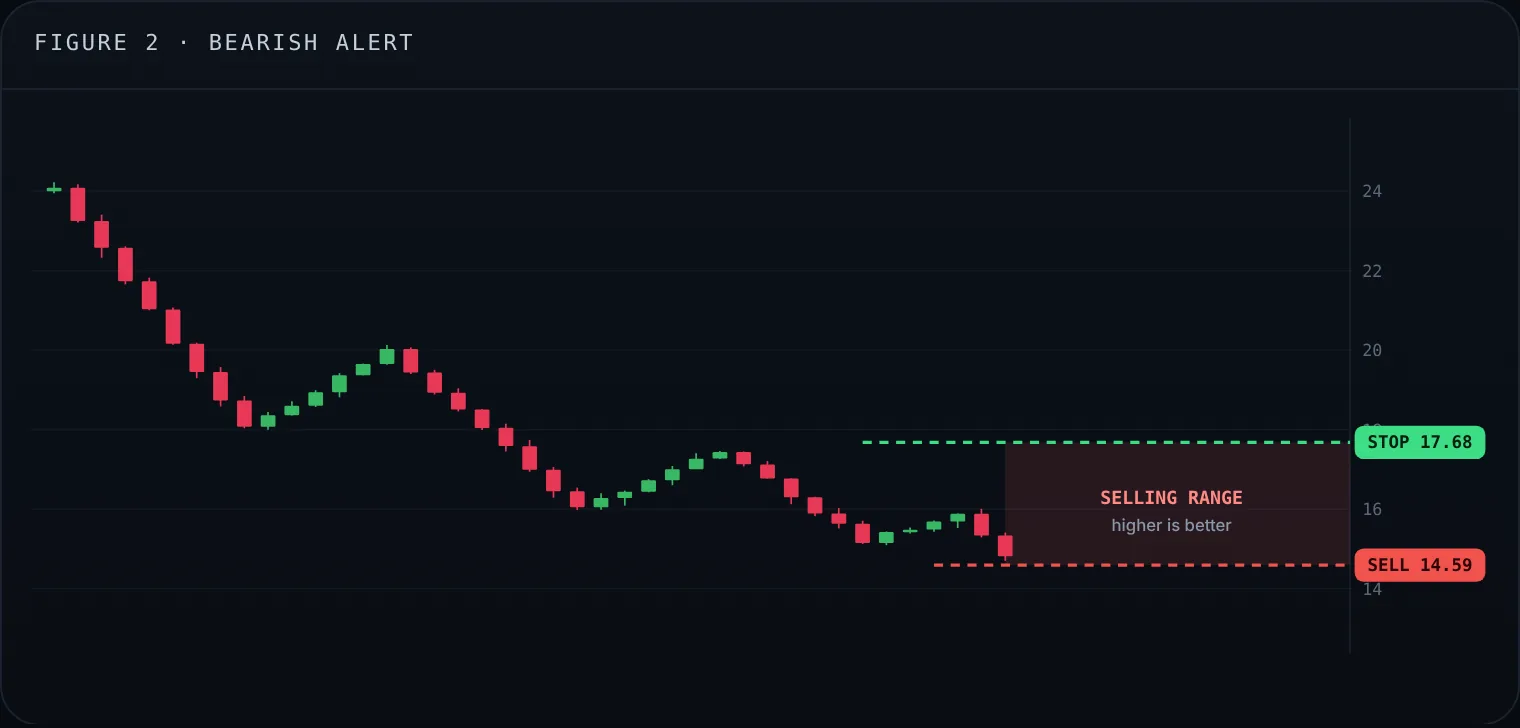
Bearish example: sell at $14.59, buy stop at $17.68.
Bearish patterns can fail too, with price rising instead. The buy stop, here $17.68, controls that risk. If price rises above it, the bearish pattern is invalid and the trade should be closed.
The selling range runs from $14.59 to $17.68. The higher you sell within it, the better:

Selling as close as possible to the buy stop maximises the potential profit and minimises the potential loss.
Key takeaways
- Every alert comes with an entry and a stop.
- Bullish: buy as close to the stop as you can within the range.
- Bearish: sell as close to the buy stop as you can within the range.
- If the stop is hit, the pattern is invalid: exit.
Alerts and examples are for education only and are not investment advice. Past patterns do not guarantee future results.
Disclaimer: Yard Charts provides technical-analysis tools and alerts. It is not investment advice. Trading involves risk of loss.