A bull market is a sustained rise. A bear market is a sustained decline. The labels describe structure and sentiment, not a single green or red day.
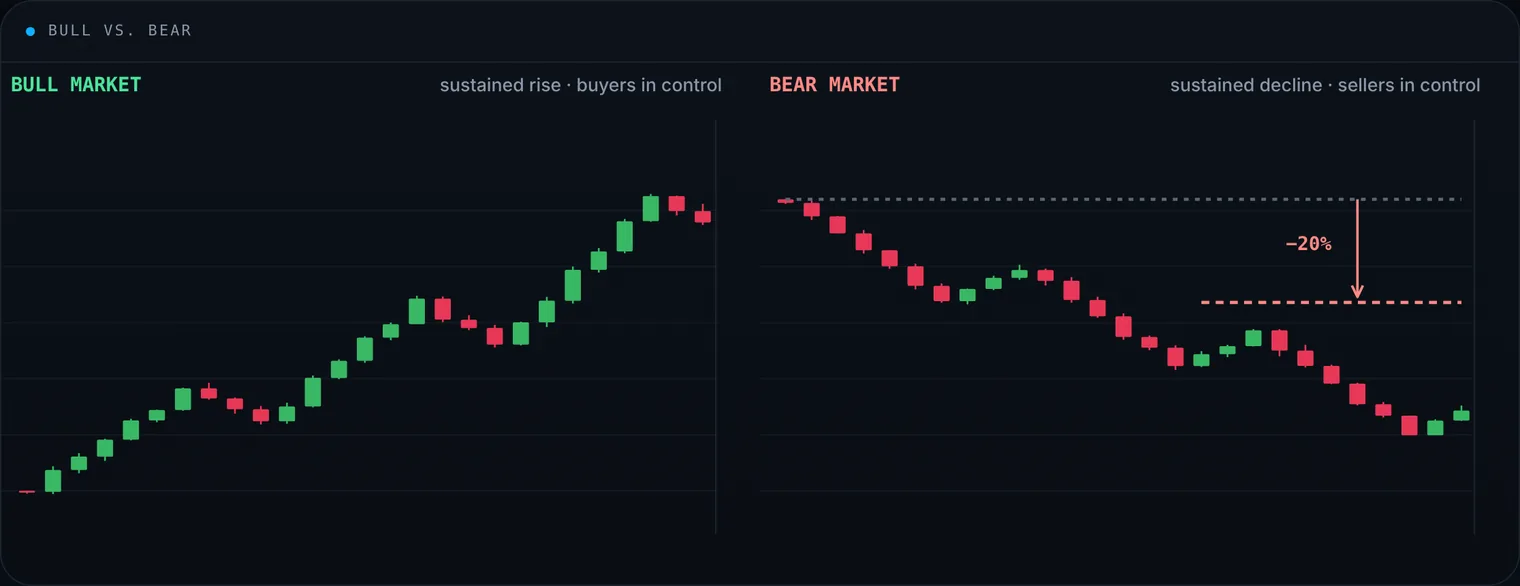
A common rule of thumb defines a bear market as a fall of about 20% from recent highs. Definitions vary.
Bull market
Price makes higher highs and higher lows, and buying dominates. Confidence, growth and earnings usually improve with it. Pullbacks happen, but the trend still points up.
Example: a company keeps beating earnings while the economy expands. Demand rises and the stock prints new highs.
Bear market
Price makes lower highs and lower lows, and selling dominates. Uncertainty rises, profits weaken and caution spreads. A common rule of thumb is a drop of about 20% from recent highs, though definitions vary.
Example: rates jump, economic data weakens and earnings disappoint. Selling feeds on itself and price keeps falling.
Why “bull” and “bear”?
A bull strikes upwards with its horns; a bear swipes downwards with its paws. The image stuck.
Not only the whole market
The same structure appears in single stocks, crypto, commodities, forex, ETFs and sectors. An index can be bullish while one name in it is already in a downtrend. That is why Yard Charts alerts come in both directions: four bullish patterns and four bearish ones.
How to read it
Use price first: higher highs and higher lows, or the reverse. Confirm with trendlines, support and resistance, chart patterns and moving averages. Trade with the active structure, not against it.
Key takeaways
- Cycles change.
- Size positions and stops for the phase you are actually in, not the one you prefer.
Alerts and examples are for education only and are not investment advice. Past patterns do not guarantee future results.
Disclaimer: Yard Charts provides technical-analysis tools and alerts. It is not investment advice. Trading involves risk of loss.